Which Cities Have the Worst Traffic in 2026?
+1 more
Depending on where you live, congested roads may be an occasional inconvenience — or a more serious issue.
Sitting in traffic can add wear and tear to your car, which may or may not be covered by an extended auto warranty. But congestion is also a matter of safety. Traffic density is “one of the biggest predictors of a crash,” said Michael Manville, a professor of urban planning at the UCLA Luskin School of Public Affairs.
To find out which metros have the worst traffic, the ConsumerAffairs Research Team analyzed data including average commute times, daily hours of congestion and fatal car crash rates in the nation’s 50 most populous metropolitan areas. Read on to find out how your metro compares.
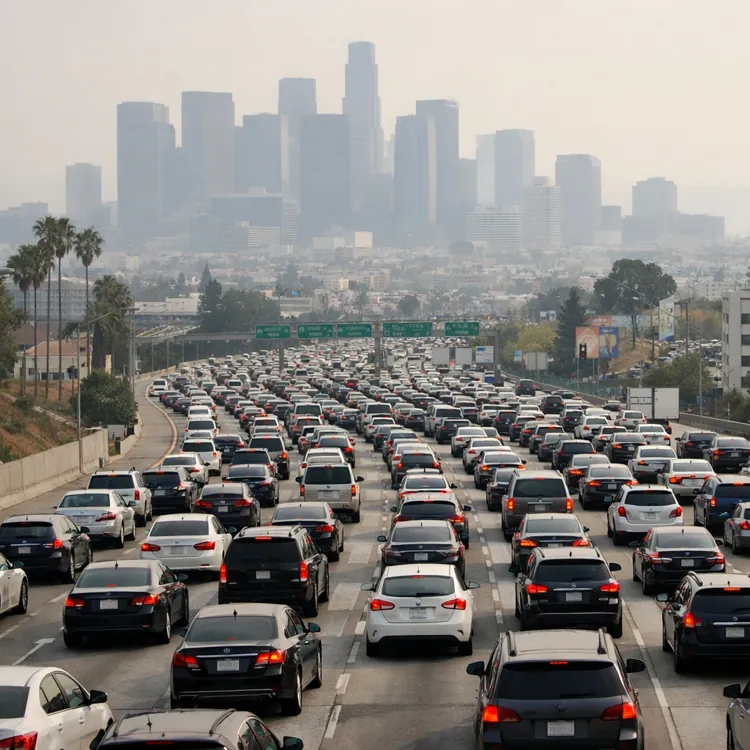
Los Angeles, California, ranks No. 1 for worst traffic overall, based largely on its 8 hours and 27 minutes of average daily congestion — nearly the equivalent of a full workday.
Jump to insightWith an average one-way driving commute of 33 minutes, Washington, D.C., has the longest travel time to work in the U.S.
Jump to insightDespite its reputation for gridlock, Atlanta, Georgia, is one of only two of the 10 worst metros for traffic with congestion under five hours during weekdays. The other is Riverside-San Bernardino-Ontario, California.
Jump to insightRochester, New York, has the least traffic of any metro on our list, thanks in part to the shortest average commute time: just 21 minutes.
Jump to insightThe streets of St. Louis, Missouri, are the most free-flowing, with just 47 minutes of congestion on an average weekday.
Jump to insightFive cities with the worst traffic
Perhaps it’s no surprise that three of America’s most populous metro areas lead the list: Los Angeles, California; Washington, D.C.; and New York, New York. All three metros have a headache-inducing combination of long commute times and heavy congestion.
San Francisco, California, and Houston, Texas, round out the top five, but these metros each earned a place at the top of the rankings for different reasons. San Francisco has a relatively long average commute but a low fatal crash rate. Houston, on the other hand, has the shortest commute time but the highest fatal crash rate among the five most traffic-heavy metros.
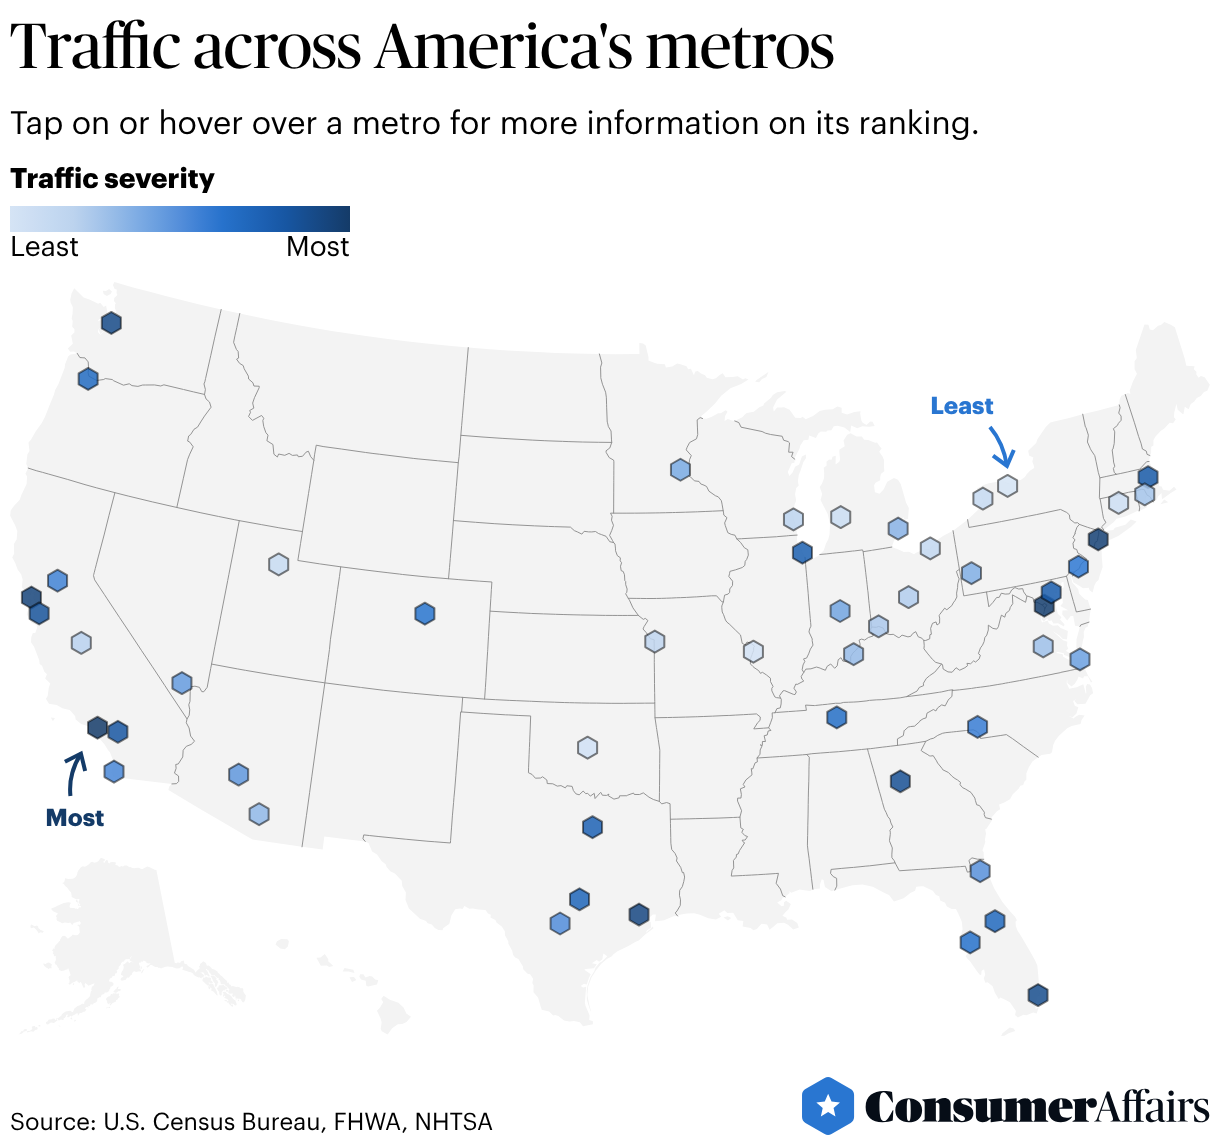
How do the rest of America’s largest metros compare? Check out the map below — then read on for a closer look at what’s driving some metros to the top of the rankings.
1. Los Angeles, California
It may be the City of Angels, but traffic in Los Angeles can be downright devilish. The Los Angeles metropolitan area has the worst overall traffic of all the areas we analyzed.
The roads stay busy, with 8 hours and 27 minutes of weekday congestion. That’s the highest in the U.S. — and 36 minutes more than in last year’s analysis.
While it won’t cure the whole metro area, Angelenos who are sick of traffic may soon be getting a little congestion relief. In May 2026, the city completed the first phase of a major subway extension for the Metro D Line. This project aims to mitigate at least a little of the infamous Los Angeles traffic by offering an alternative to driving between downtown and the Westside — especially as the city prepares to host a series of 2026 World Cup games and the 2028 Olympics.
Key metrics:
- Average daily commute time: 30 minutes (sixth highest)
- Average duration of weekday congestion: 8 hours and 27 minutes (highest)
- Annual rate of fatal car crashes: 7.09 per 100,000 people
2. Washington, D.C.
The nation’s capital sees some serious congestion, and it’s especially rough for those who have a car-based commute to work. It takes an average of 33 minutes for drivers in the Washington metro area to reach their destination. That’s the longest travel time to work of all the metros we compared.
While D.C. traffic is formidable, increased usage of micromobility options (like shared bikes and scooters) seems to be making a dent in the volume of motor vehicle traffic through “vehicle substitution,” or replacing the use of a private vehicle with another mode of travel, according to an April 2026 report from the Rudin Center for Transportation Policy and Management at New York University. For instance, nearly a quarter (23%) of all Lime scooter riders in Washington reported they had opted to take a scooter instead of using a car on their latest trip.
Key metrics:
- Average daily commute time: 33 minutes (highest)
- Average duration of weekday congestion: 6 hours and 27 minutes (fifth highest)
- Annual rate of fatal car crashes: 4.89 per 100,000 people
3. New York, New York
New York may be the city that never sleeps — but get caught in the Big Apple’s endless gridlock long enough and you might be tempted to nod off.
In the New York metro area, motorists spend more than half an hour on their daily driving commutes, and roads are congested for more than six and a half hours on an average weekday.
Considering how much time New York-area motorists already spend at a standstill, it’s worrying that this trend could only be increasing. Experts estimate that vehicle miles traveled in the city — a reflection of the volume of cars on the road — has increased by roughly 16% from 2005 to 2023.
One bright spot? It’s time, not safety, that places New York near the top of the rankings. Weekday congestion and average commutes to work are among the worst in the country, but New York has one of the lowest rates of fatal traffic crashes among the metros we analyzed.
Key metrics:
- Average daily commute time: 31 minutes (fourth highest)
- Average duration of weekday congestion: 6 hours and 39 minutes (fourth highest)
- Annual rate of fatal car crashes: 4.24 per 100,000 people (fourth lowest)
4. San Francisco, California
San Francisco has the fourth-worst traffic in the country, but it isn’t all bad news for the Bay Area. Drivers there have the second-longest average commute in the country, but the metro also has a relatively low rate of fatal traffic crashes.
Speaking of roadway safety, San Francisco has been leading some of California’s efforts to make streets safer by slowing drivers down. With the introduction of new speed cameras — the first city in the Golden State to install them — speeding has fallen by nearly 80%, according to the San Francisco Municipal Transportation Agency. That’s approximately 40,000 fewer cases of speeding every day across all camera locations, it said.
Key metrics:
- Average daily commute time: 32 minutes (second highest)
- Average duration of weekday congestion: 5 hours and 56 minutes (eighth highest)
- Annual rate of fatal car crashes: 5.10 per 100,000 people (ninth lowest)
5. Houston, Texas
Houston’s Space City nickname might feel pretty ironic when you’re stuck in bumper-to-bumper traffic during rush hour.
The Houston metro area has the fifth-worst traffic in America, and perhaps the worst combination of traffic congestion and roadway safety. Like the other worst-ranked metros, Houston has one of the longest average daily commutes and bad weekday congestion. However, it stands out for having a high fatal crash rate, too: 10.33 per 100,000 people, which is 15th highest in the country.
As in Los Angeles, concerns around traffic are spiking as Houston prepares to welcome thousands of visitors for the 2026 World Cup. Some drivers have reported that because the traffic on Beltway 8 has gotten so bad, they’re opting to take surface streets to reach their destination, leading to questions about whether expressway tolls really help manage traffic flow.
Key metrics:
- Average daily commute time: 30 minutes (eighth highest)
- Average duration of weekday congestion: 6 hours and 22 minutes (sixth highest)
- Annual rate of fatal car crashes: 10.33 per 100,000 people
Which major cities have the least traffic congestion?
Rochester, New York, has the least traffic among the most populous metros in the nation. Its ranking is driven by quick commutes, with the shortest average travel time to work in the U.S. (21 minutes).
Five of the 10 metros with the least traffic are in the Midwest. St. Louis, Missouri, ranks second for least overall traffic, but it has the lowest weekday congestion time in the country. On an average weekday, roads are clogged for just 47 minutes. That’s more than three hours less than the national average.
The 10 metros with the least traffic are:
- Rochester, New York
- St. Louis, Missouri
- Oklahoma City, Oklahoma
- Hartford, Connecticut
- Grand Rapids, Michigan
- Salt Lake City, Utah
- Buffalo, New York
- Cleveland, Ohio
- Kansas City, Missouri
- Milwaukee, Wisconsin
So, what might all these metros have in common?
“Roads are engineered with a certain volume (of traffic) in mind,” said Madalyn Smith, an urban planner in the Atlanta metro area. From the number of lanes on a roadway to the width of each lane, many of these cities were “engineered for something much bigger,” she explained.
The way to address traffic is to make cars less necessary. You can really cut out a lot of cars by making shorter trips much more possible (without them).”
Consider the Rust Belt metros dominating this end of the rankings, including Rochester, St. Louis, Grand Rapids, Buffalo, Cleveland and Milwaukee. These cities may have been built with a physical footprint to support booming population growth and thriving industry a few generations ago, but it’s now a kind of “excess infrastructure” for the current population.
Cities may also experience less congestion because their footprint helps spread out the traffic burden. When there’s a lot of “redundancy” in the roadways, or multiple ways to reach the same destination, “you have a lot more ways to disperse traffic,” Smith explained.
Why traffic happens
From peak traffic times to car-choked corridors, every metro area has its own patterns of congestion — and urban dwellers across the country will be the first to claim their metro has it worst. But what’s causing all this traffic in the first place?
Put simply, traffic happens when too many cars are on the road at the same time.
It ultimately comes down to the sheer volume of cars on the road, said Manville of UCLA. “Congestion is oftentimes a sign of economic prosperity,” he explained. Economic opportunities drive population growth, and more households in an area mean more vehicles on the road.
In the minds of many motorists, traffic just comes with the territory of living in a big city. But many urbanists argue that it doesn’t have to be this way.
“The way to address traffic is to make cars less necessary,” said Smith. “You can really cut out a lot of cars by making shorter trips much more possible (without them),” such as with robust transit options and infrastructure for pedestrians and cyclists, she said.
How does your metro’s traffic rank?
It’s one thing to endure rush-hour congestion or navigate holiday traffic. When it comes to day-in, day-out driving in city traffic, how do America’s largest metros stack up?
Check out the full data table below, which includes rankings from the past two years. (Because we updated our methodology for 2026, year-over-year changes in congestion and fatal crash data are more revealing than year-over-year changes in overall rank.)
Methodology
The ConsumerAffairs Research Team analyzed the 50 most populous U.S. metropolitan areas with sufficient data to identify the cities with the worst traffic. Throughout this analysis, “city” and “metro” may be used interchangeably, though all data is analyzed at the metropolitan statistical area (MSA) level.
For each category metric, the metropolitan area with the highest value received the maximum number of points, with all other metros receiving relative scores. Category scores were summed to calculate an overall score out of 100.
- Average driving time to work (45 points): We used the most recent (2024) data from the U.S. Census Bureau, analyzing commute times among workers age 16 and older who drove to a workplace outside the home. This metric only includes those who drove alone, excluding other commuting methods.
- Hours of congestion (45 points): We analyzed congested hours using data from the Federal Highway Administration’s most recent Urban Congestion Report (October to December 2025). The FHWA defines congested hours as “the average number of hours during specified time periods in which road sections are congested — speeds less than 90% of free-flow speed (e.g., 54 mph if free-flow speed is 60 mph).” These hours are measured on weekdays from 6 a.m. to 10 p.m.
- Fatal car crashes per 100,000 people (10 points): Data comes from the National Highway Traffic Safety Administration’s Fatality Analysis Reporting System (2024).
Some metropolitan areas met the population threshold but lacked sufficient data and were excluded: Raleigh, North Carolina; Memphis, Tennessee; and Birmingham, Alabama. They were replaced by the next-largest metros with complete data: Hartford, Connecticut; Tucson, Arizona; and Rochester, New York.
Reference policy
We love it when people share our findings! If you do, please link back to our original article to credit our research.
Questions?
For questions about the data or if you'd like to set up an interview, please contact egomes@consumeraffairs.com.
Article sources
ConsumerAffairs writers primarily rely on government data, industry experts and original research from other reputable publications to inform their work. Specific sources for this article include:
- U.S. Census Bureau, “Explore Census Data.” Accessed May 11, 2026.
- Federal Highway Administration, “Quarterly Urban Congestion Reports.” Accessed May 11, 2026.
- National Highway Traffic Safety Administration, “Fatality Analysis Reporting System (FARS).” Accessed May 11, 2026.
- Metro, “Metro D Line Subway Extension.” Accessed May 11, 2026.
- NYU Wagner, “Micromobility, Macro Utility.” Accessed May 11, 2026.
- OpenPlans, “Hit the Brakes: Understanding and Reducing Vehicle Miles Traveled in NYC.” Accessed May 11, 2026.
- San Francisco Municipal Transportation Agency, “One Year in, Speeding is Down by 79% at Speed Safety Camera Locations.” Accessed May 11, 2026.
- Houston Chronicle, “Will Houston drivers give up their cars during the World Cup? Here's how bad traffic could get.” Accessed May 11, 2026.
- Click2Houston.com, “Houston drivers paid nearly $1 billion in tolls — so why are they still stuck in traffic?” Accessed May 11, 2026.
Figures