Elderly poverty statistics 2026
+1 more

Poverty affects older adults uniquely due to their vulnerability in declining health and isolation. Lacking adequate income or retirement savings leaves many seniors unable to afford basics like food, housing, and medications as physical and cognitive abilities fade. The crushing stress of economic instability often exacerbates chronic illness, disability, depression and loss of independence. While poverty harms Americans of all ages, the elderly face heightened risks that require focused solutions to prevent spirals into severe hardship or premature death.
More than 17 million older adults are economically insecure.
Jump to insightIn 2015, 40% of retirees relied on Social Security for at least half of their income.
Jump to insightOver the next six years, the number of elderly Americans without homes could triple.
Jump to insightPoverty by age group
The Center on Poverty and Social Policy at Columbia University estimates that 8 million Americans slipped into poverty during the coronavirus pandemic.
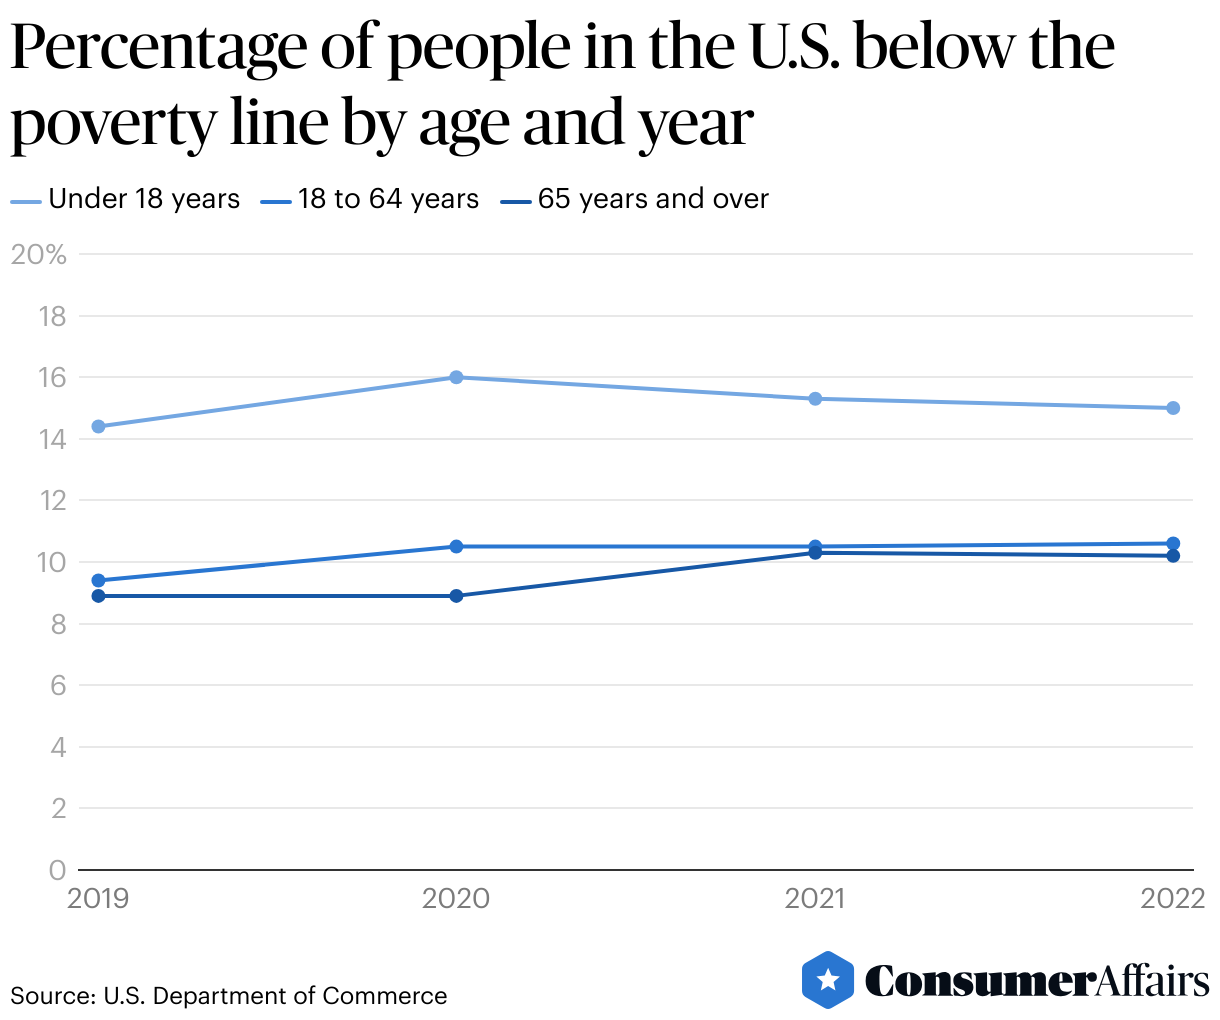
In 2022, the poverty rates for all three major, census-defined age groups were higher than they had been in 2019 prior to the pandemic. Between 2021 and 2022, poverty rates changed very little across these groups. People ages 65 and older had the lowest 2022 poverty rate across the three groups.
- In 2019, the poverty rate for people ages 65 and older was 8.9%. By 2022 it had climbed to 10.2%, a 0.1 percentage point drop from 2021.
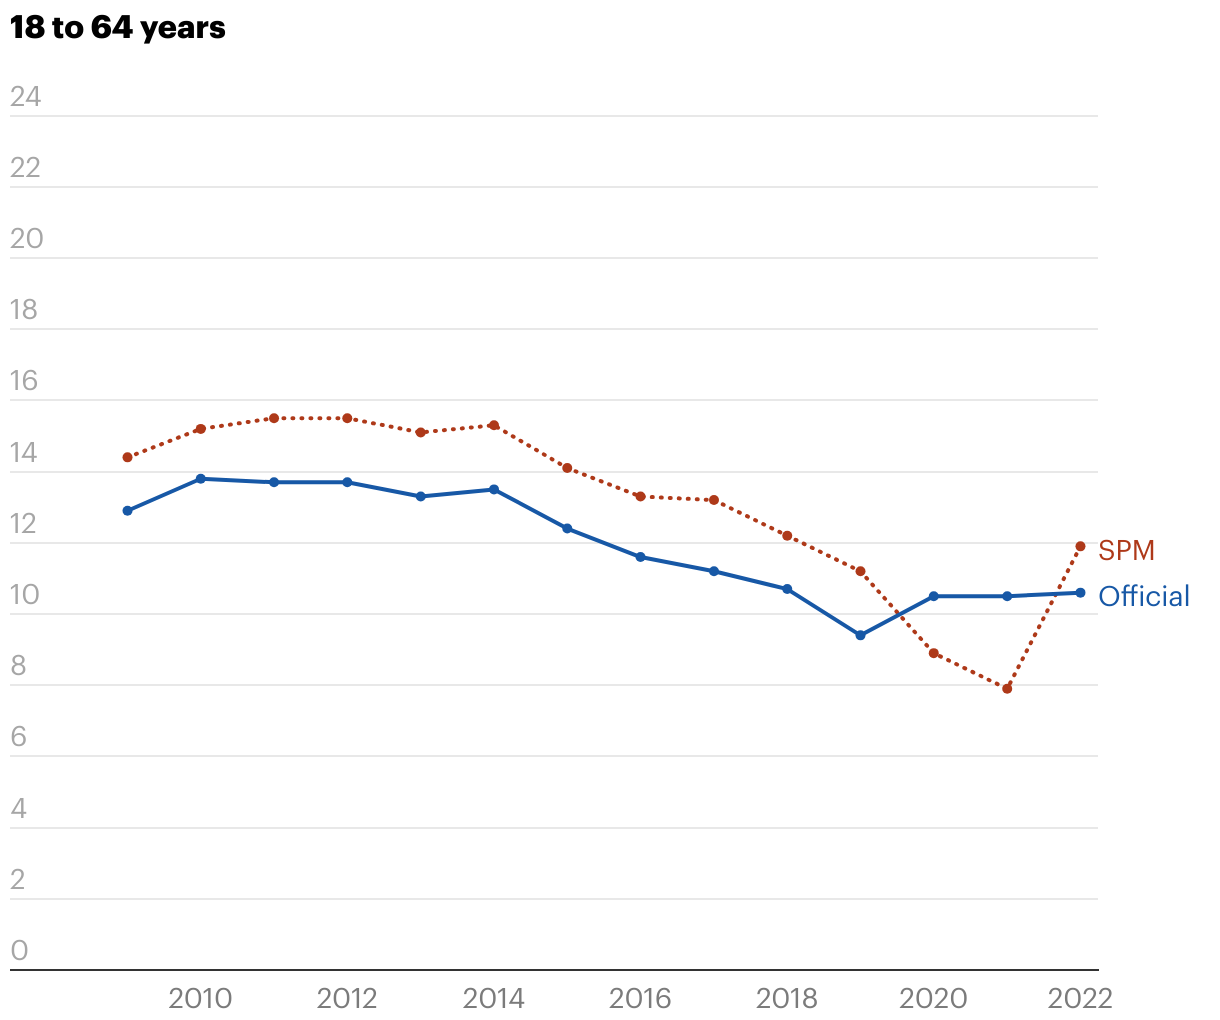
- The poverty rate for people between the ages of 18 and 64 rose from 9.4% in 2019 to 10.6% in 2022.
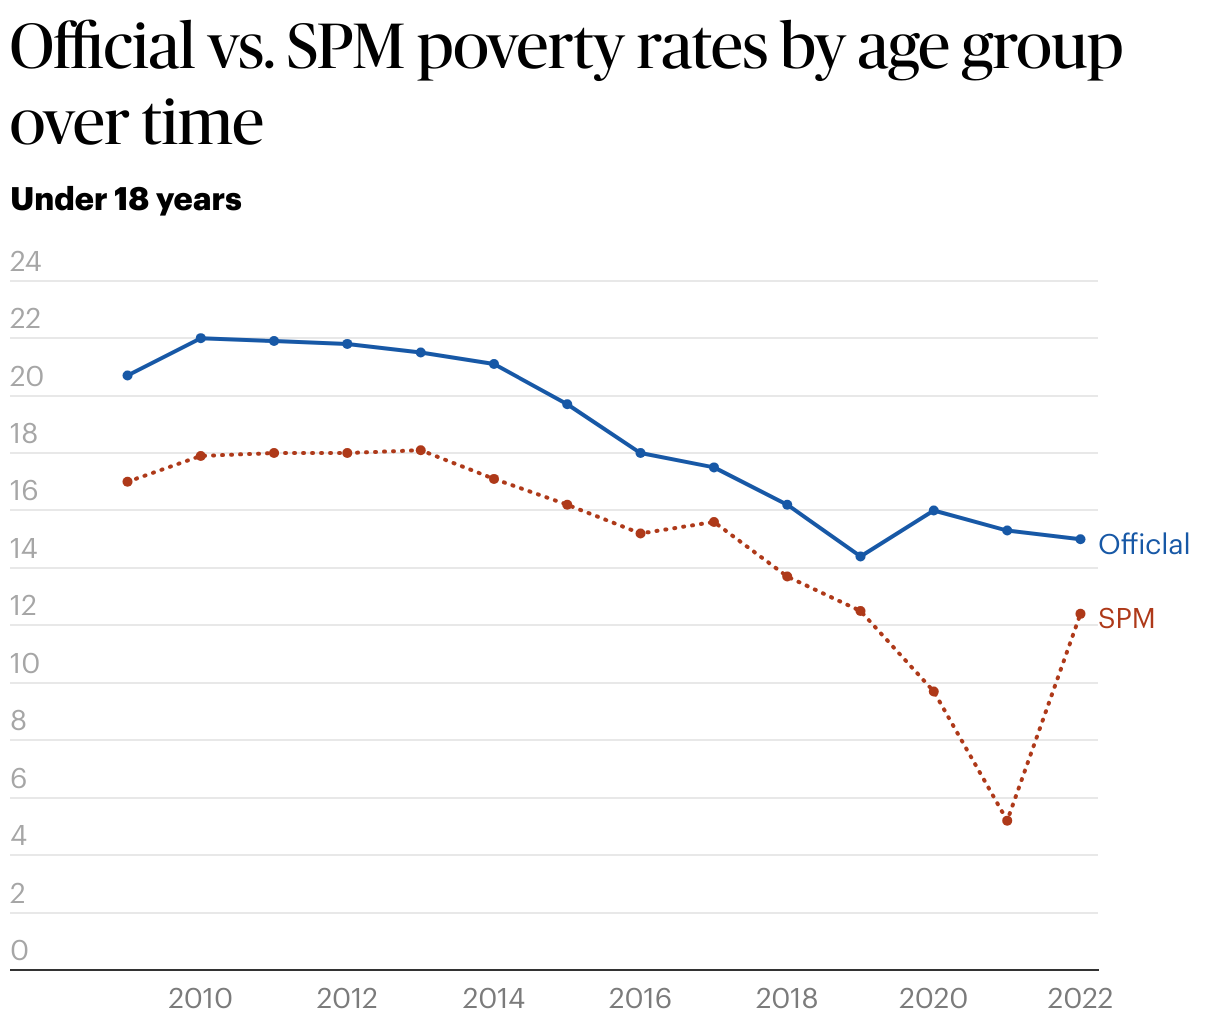
- The poverty rate for people under the age of 18 rose from 14.4% in 2019 to 15% in 2022.
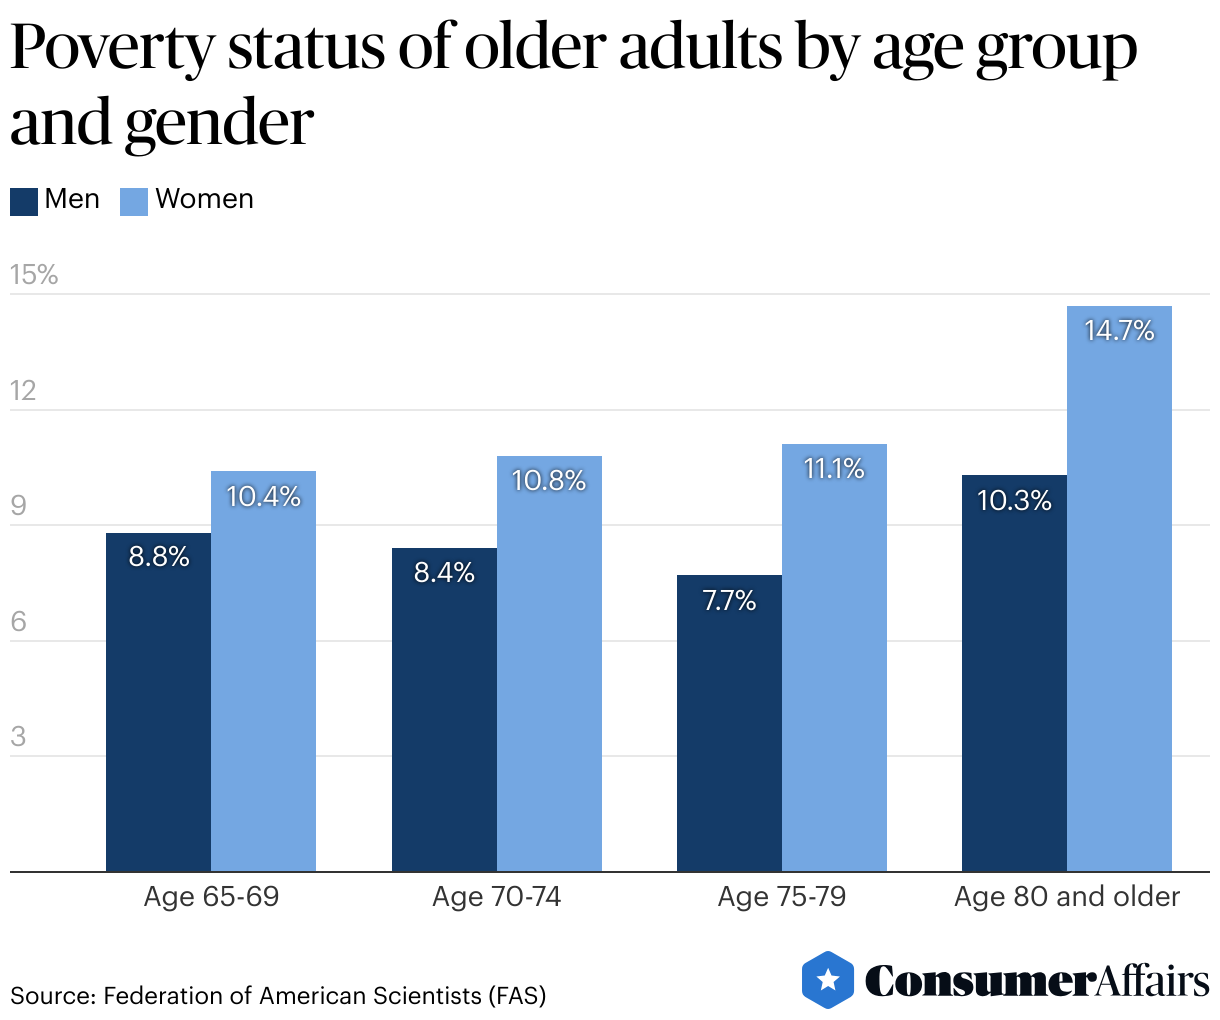
Elderly poverty rates by age and gender (graph)
According to the Federation of American Scientists, women 80 and older had the highest poverty rate among all senior age groups in 2021 — 14.7%. Older women are more likely to live in poverty than men as a result of wage discrimination and having to take time out of the workforce for caregiving.
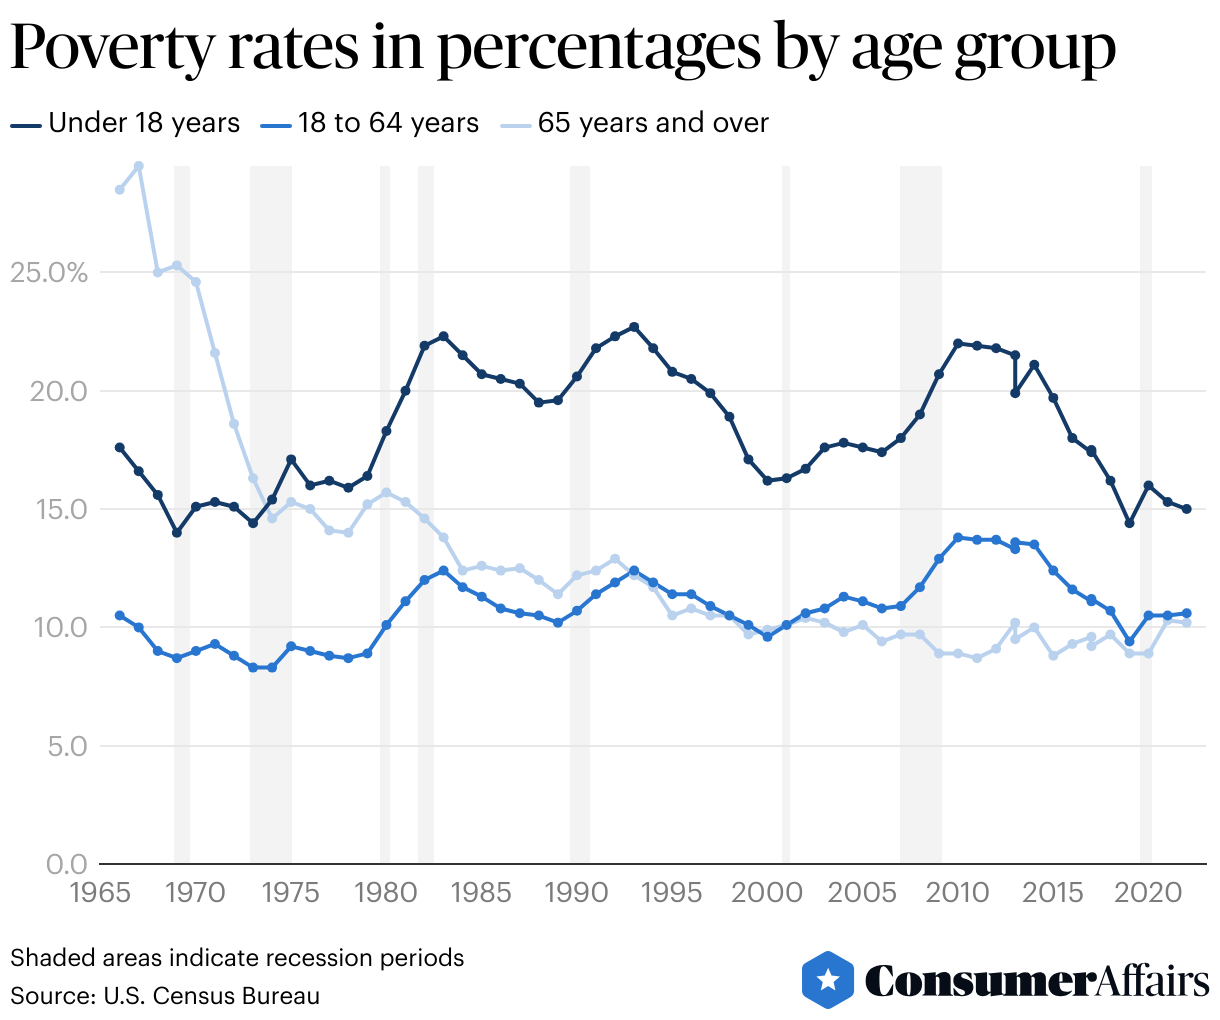
Elderly poverty by age group over time (graph)
Among older people, those ages 80 and over are most likely to live in poverty (as of 2021). In addition to age and gender, whether or not a person lives alone also plays a part in elderly poverty. Both men and women 65 and older who are married and living with a spouse are less likely to live in poverty than those who are not married. Nineteen percent of women ages 80 and older who live alone are in poverty. Married men have a much lower poverty rate (5.8%) than men who have never married (18.7%).
Planning for elder care is important. Otherwise, you might underestimate how much you need to retire. For more information, read about the costs of aging in place, nursing home costs in 2021 and different types of senior living next.
Impact of health status on poverty rates
The majority of older adults who are in fair or poor health have incomes below the poverty level. Those living in poverty are less likely to have adequate resources for food, housing, health care and other significant needs, which can in turn affect physical and mental health.
In 2020, adults 65 and older accounted for 16% of the U.S. population but 80% of coronavirus deaths in the U.S. This is higher than their share of deaths from all other causes (75%) over the same time period.
- In 2019, nearly 6 in 10 older adults considered to be in fair or poor health had incomes below 200% of the poverty level, compared with about 3 in 10 older adults in good or excellent health.
- As of late 2020, 95% of Americans killed by COVID-19 were 50 or older, with the odds getting worse as people age — a plurality of COVID deaths occurred in those 85 and older.
- In 2022, 9.1% of households experiencing food insecurity included a senior citizen. This was a statistically significant increase compared to the 7.1% of households in 2021.
In the beginning of the coronavirus pandemic, seniors experienced increased food insecurity. This could be due to fewer in-person visits from friends and family members or less involvement with community outreach programs.
For more information, read about Medicare vs. Medicaid, Medicare supplemental insurance or long-term care insurance next.
Senior poverty rates over time (graph)
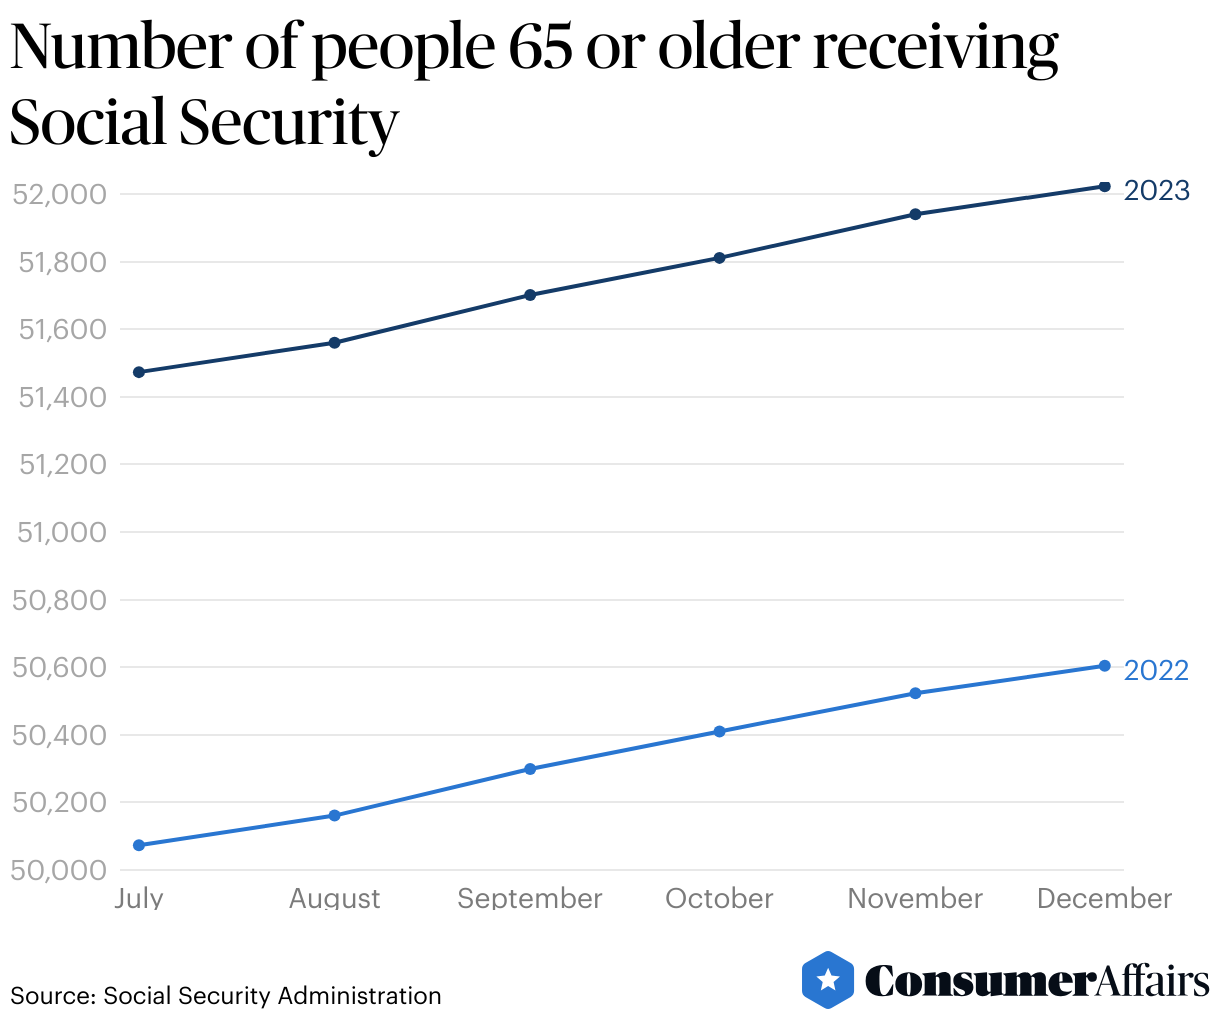
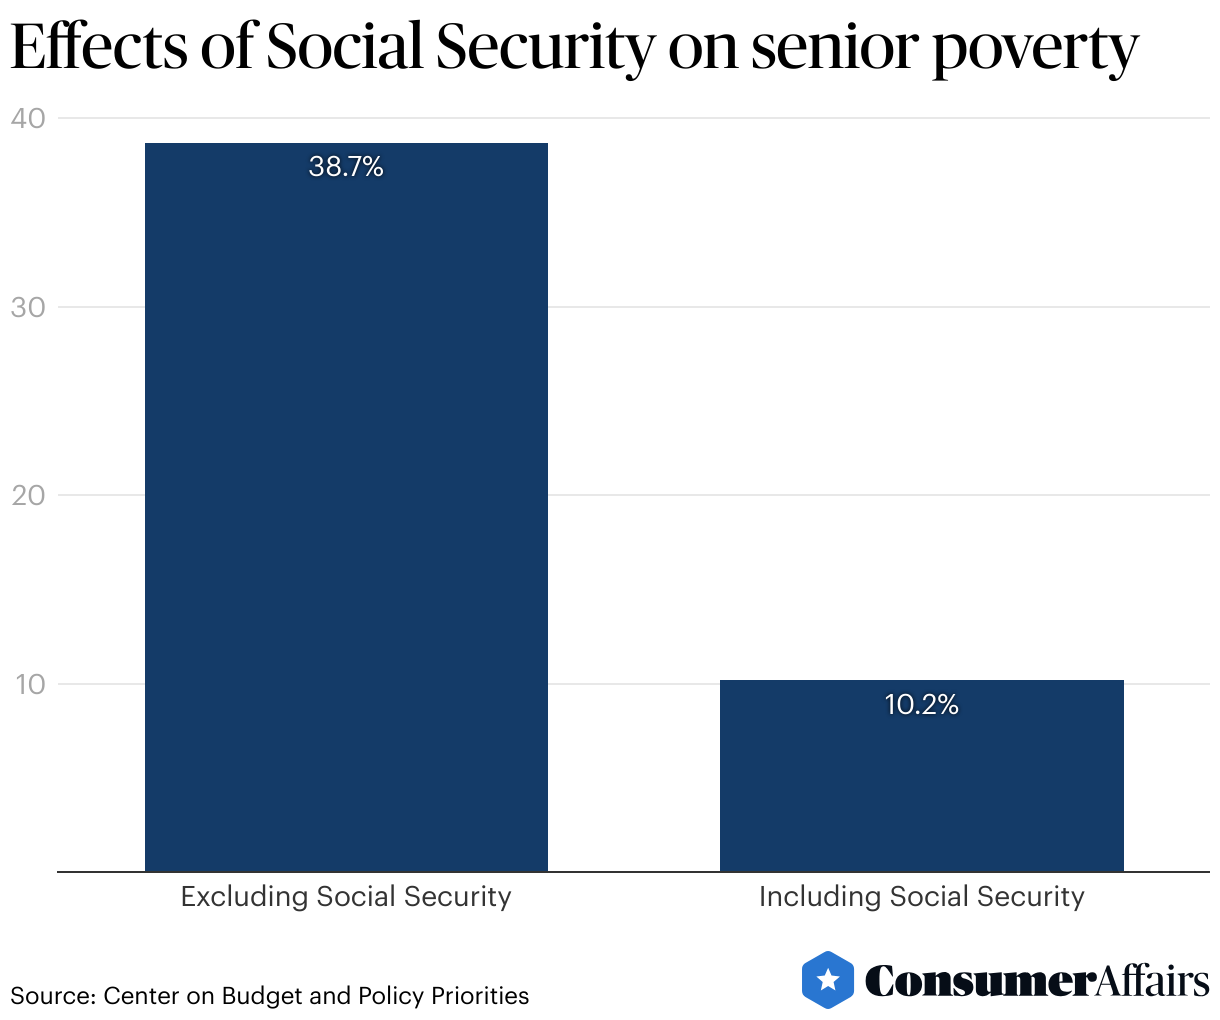
Each year, Social Security benefits lift more Americans out of poverty than any other program. Over 16.5 million elderly adults are lifted out of poverty by obtaining Social Security benefits.
Social Security and poverty predictions
Americans are living longer — and, at the same time, the birth rate is decreasing. For several years now, we’ve been in the middle of a “gray tsunami” caused by 10,000 baby boomers turning 65 each day. In addition, those in Generation X will start turning 65 by 2030.
According to the Social Security Administration, Social Security is not sustainable over the long term with the current benefits and tax rates.
- The number of retired workers is expected to double in about 50 years.
- Both Old-Age and Survivors Insurance (OASI) and Disability Insurance (DI) reserves will be depleted by 2035.
Elderly homelessness on the rise
Older people have the highest risk of putting more than 30% of their incomes toward rent or mortgage payments, according to the Harvard Joint Center for Housing Studies.
- New York City’s over-50 homeless population is projected to reach 25,000 by 2030.
- Another 2.4 million of the poorest seniors will lose access to affordable housing by 2038.
Understanding poverty statistics
The official poverty measure is just one way to evaluate economic well-being. Since 2011, the U.S. Census Bureau has reported on the Supplemental Poverty Measure (SPM) with support from the Bureau of Labor Statistics (BLS).
SPM extends the original measure by also taking into consideration government programs and geographic differences in the cost of living. Currently, the most important distinguishing factor between this and the original poverty measure is that SPM factors in the cost for out-of-pocket medical expenses.
As of 2022, 10.2% of people ages 65 and older have incomes below the official poverty threshold under the official poverty measure. However, this number increases to 14.1% based on the SPM poverty thresholds.
It’s important to note that poverty status is not measured for institutionalized populations, including those in nursing facilities, prisons or military bases.

A brief history of Social Security
President Franklin Delano Roosevelt signed the Social Security Act into law on August 14, 1935, instituting a social insurance program to provide those 65 and older with a post-retirement income. Today, the Social Security Administration administers retirement benefits, disability benefits, benefits for surviving spouses and children of working family members and Supplemental Security Income.
We put those payroll contributions there so as to give the contributors a legal, moral and political right to collect their pensions and their unemployment benefits. With those taxes in there, no damn politician can ever scrap my Social Security program.”
Historically, older Americans have been at higher risk of economic instability. For most of the 20th century, the percentage of all people below the poverty line has decreased inversely with the rise in Social Security expenditures.
Article sources
ConsumerAffairs writers primarily rely on government data, industry experts and original research from other reputable publications to inform their work. Specific sources for this article include:
- U.S. Census Bureau, “Poverty Status in 2023.” Accessed Feb. 6, 2025.
- U.S. Census Bureau, “Poverty in the United States: 2023.” Accessed Feb. 6, 2025.
- Social Security Administration, “Monthly Statistical Snapshot, December 2024.” Accessed Feb. 6, 2024.
- Social Security Administration, “How much will the COLA amount be for 2025 and when will I receive it?” Accessed Feb. 6, 2024.
- Statista, “Number of coronavirus disease 2019 (COVID-19) deaths in the U.S. as of June 14, 2023, by age.” Accessed Feb. 6, 2024.
- Feeding America, “Food Insecurity in 2023.” Accessed Feb. 6, 2024.
- University of Pennsylvania, “New Report Predicts Aging Homeless Population Will Nearly Triple by 2030.” Accessed Feb. 6, 2024.
- National Council on Aging (NCOA), “Get the Facts on Economic Security for Seniors.” Accessed Jan. 25, 2024.
- Center on Budget and Policy Priorities (CBPP), “Policy Basics: Top Ten Facts about Social Security.” Accessed Jan. 25, 2024.
- The New York Times Magazine, “Elderly and Homeless: America’s Next Housing Crisis.” Accessed April 5, 2021.
- Center of Poverty & Social Policy, Columbia University, “Estimating Monthly Poverty Rates in the United States.” Accessed April 5, 2021.
- Center on Budget and Policy Priorities (CBPP), “Social Security Lifts More Americans Above Poverty Than Any Other Program.” Accessed Jan. 25, 2024.
- Justice in Aging, “Older Women & Poverty: Special Report, December 2018.” Accessed April 5, 2021.
- Federation of American Scientists (FAS), “Poverty Among Americans Aged 65 and Older.” Accessed April 5, 2021.
- Kaiser Family Foundation, “What Share of People Who Have Died of COVID-19 Are 65 and Older – and How Does It Vary By State?.” Accessed April 5, 2021.
- Brookings, “For Millions of Low-income Seniors, Coronavirus Is a Food-security Issue.” Accessed April 5, 2021.
- Center on Budget and Policy Priorities (CBPP), “SNAP Helps Millions of Low-income Seniors.” Accessed April 5, 2021.
- Centers for Disease Control and Prevention (CDC), “Identifying Vulnerable Older Adults and Legal Options for Increasing Their Protection During All-Hazards Emergencies.” Accessed April 5, 2021.
- U.S. Census Bureau, “2020 Census Will Help Policymakers Prepare for the Incoming Wave of Aging Boomers.” Accessed April 5, 2021.
- American Society on Aging, “Homelessness Among Older Adults: An Emerging Crisis.” Accessed April 5, 2021.
- Social Security Administration, “The Supplemental Poverty Measure (SPM) and the Aged: How and Why the SPM and Official Poverty Estimates Differ.” Accessed April 5, 2021.
- Congressional Research Service, “Poverty Among Americans Aged 65 and Older.” Accessed April 5, 2021.
- National Bureau of Economic Research (NBER), “Social Security and the Evolution of Elderly Poverty.” Accessed April 5, 2021.
- U.S. Census Bureau, “Current Population Survey, 2010 to 2020 Annual Social and Economic Supplements.” Accessed April 5, 2021.
- U.S. Department of Health & Human Services, “2021 Poverty Guidelines.” Accessed April 5, 2021.
- U.S. Department of Commerce, “Poverty in the United States: 2022.” Accessed Jan. 25, 2024.
- Social Security Administration, “Fact Sheet.” Accessed Jan. 25, 2024.
- The Senior Citizens League, “2023 Social Security Loss of Buying Power Study.” Accessed Jan. 25, 2024.
Figures
Current Social Security trends