Comparing the Cost of Living Across Generations (2026)

+1 more

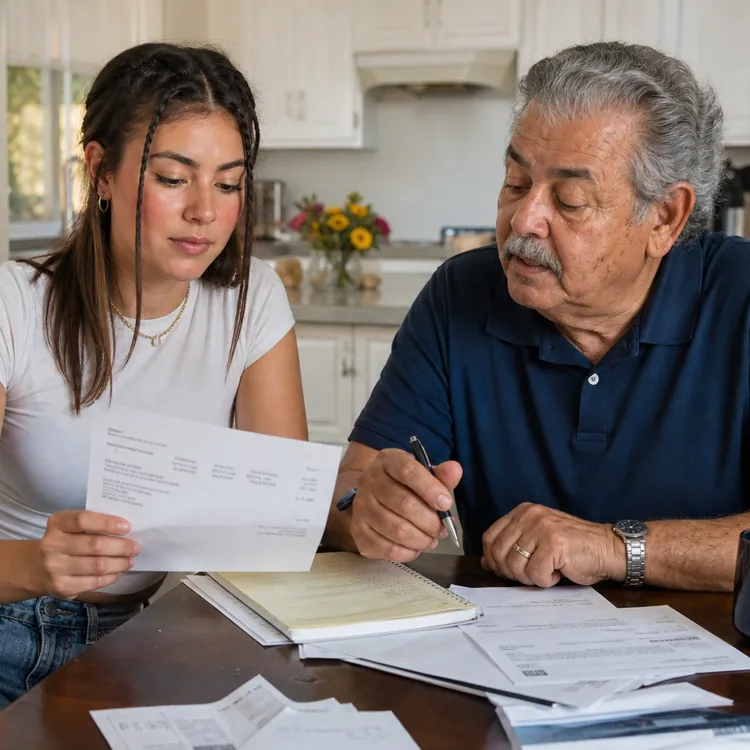
Every generation seems to believe the next one has it easier, or harder, than they did. Say it out loud at a dinner table, and you might just start an argument. A 28-year-old complains that rent eats up half her paycheck. Her grandfather isn’t sympathetic and shakes his head. “I was married, bought a house and started a family by your age,” he says. “Maybe you just need to work harder.”
Instead of relying on gut feelings and family arguments, we went straight to the numbers. What did it cost to build a life in 1974? How does that stack up against building one today? The answer is more nuanced than either side of that dinner table might expect. Some things have become more expensive over the past 50 years, while others are more affordable.
The ConsumerAffairs Research Team analyzed changes in income, inflation and the cost of major expenses like housing, healthcare and college tuition to see how far a dollar goes today compared with five decades ago.
Key insights
After adjusting for inflation, the purchasing power of the median income has grown 73% over the past 50 years.
Jump to insightEducation and healthcare costs outpaced income growth, reducing buying power by 43% and 17%, respectively.
Jump to insightAverage annual public college tuition rose more than 200%, from an inflation-adjusted $3,270 in 1974 to $9,872 today.
Jump to insightInflation-adjusted healthcare spending rose from $972 to $1,632 per person over the past five decades.
Jump to insightHomeownership takes longer to reach. The median first-time homebuyer age rose from 29 in 1981 to 40 today.
Jump to insight50 years of prices: what got cheaper, what didn’t
Most people assume everything costs more today than it did 50 years ago. In one sense, they’re right. A dollar doesn’t stretch as far as it used to, and economists have a name for that: inflation. They track it using the consumer price index, or CPI, which measures changes in what everyday goods and services cost over time.
The chart below breaks down how different spending categories have grown relative to overall inflation:
Rising prices only tell half the story, though. We also need to account for whether paychecks grew fast enough to keep up — and that’s what buying power measures. When income grows faster than prices, buying power improves. When prices win that race, buying power shrinks, even if your paycheck looks bigger than it used to.
Paychecks actually kept pace better than most people would guess. Buying power climbed 73% between 1974 and 2024 — meaning the average person today can afford a lot more than someone in 1974, once you adjust for inflation. Not bad, right? But look closer, and two categories buck that trend. College tuition buying power sank 43% over the same 50 years. Healthcare wasn’t far behind, down 17%.
So … why does a 73% gain feel disconnected from people’s lived experience?
Mariano Torras, a professor and chair of the Finance and Economics Department at Adelphi University’s Robert B. Willumstad School of Business in Garden City, New York, pointed to a distinction that’s easy to miss in the aggregate numbers.
Many everyday goods, like electronics and appliances, have gotten cheaper relative to income. But those are purchases people can put off. Housing, education and healthcare are not. “The average prices of less avoidable expenditures have risen much faster than general inflation,” Torras said. “When the costs that people can’t easily avoid rise faster than their incomes, it’s understandable that they feel squeezed.”
Martin Lynch, the president of the Financial Counseling Association of America, added another layer to consider. A new phone or pair of jeans is an occasional purchase. But housing, healthcare and educational costs come due on a regular basis, which compounds the sting far beyond what an annual average can capture.
How much have housing prices risen since the 1970s?
Housing looks nothing like it did 50 years ago. Home prices and rents have both climbed since 1974, but buying and renting have become increasingly different experiences.
“Many existing homeowners have benefited from decades of rising home prices,” Torras noted. “Renters, meanwhile, face increasing costs and are unable to build much equity.”
The financial starting line has also moved, Torras added. Young adults today face higher home prices relative to income. Plus, they have greater student debt and higher healthcare and childcare costs than previous generations at similar ages, he said.
The graphic above shows how median home prices have grown since 1974, both in raw dollars and in inflation-adjusted figures. Some of that increase simply reflects inflation, as a dollar buys less than it used to. But home values have also risen in real terms, meaning homes cost more today even after accounting for inflation.
The home sale price is also only part of the picture. Mortgage rates, insurance premiums and property taxes also shape what a buyer pays each month. Two houses with the same price tag can carry different monthly bills depending on when someone buys. Anyone ready to buy a home will want to weigh all of those costs, not just the sticker price.
On the other side of that divide is renting. As home prices climbed out of reach for many, renting shifted from a temporary step toward homeownership to a longer-term reality. The chart above shows how the median rent has grown over the same 50-year period. Check out the inflation-adjusted numbers, so you can see how much of that growth is real versus just the effect of a shrinking dollar.
You can see the widening gap between renting and owning play out in real numbers. Back in 1981, the typical first-time homebuyer was just 29, according to the National Association of Realtors. Today, that median age has climbed to 40, and it’s not hard to see why. “It takes the average first-time homebuyer seven years to save up the down payment on a home,” Lynch said.
Note: Keep in mind the housing costs are national medians, not local numbers. Home prices and rents vary; for example, someone shopping in a high-cost market like the Bay Area will see different figures from these national numbers.
How healthcare costs have changed since the 1970s
“Out-of-pocket” healthcare spending refers to the money Americans pay directly for care, including deductibles, copays and coinsurance. It excludes costs paid by employers, private insurers or government programs. Out-of-pocket spending per person has grown substantially since 1974, rising from $972 to $1,632 in inflation-adjusted dollars. That’s a 68% increase over 50 years.
Several factors are behind that climb, according to Torras. Advances in medical technology, rising labor costs and increased administrative complexity have all played a role, though no single factor explains the increase on its own.
Note: These figures reflect only what patients pay directly, not the full cost of healthcare. Much of the remaining cost is paid by private insurers and government programs. How much of a financial squeeze rising healthcare costs create depends on a person’s coverage, healthcare needs and the services they use.
The rising cost of college tuition
If you ask someone who went to college decades ago how they paid for it, you’ll likely hear some version of the same answer. They got a part-time job, maybe a small loan and a degree with little or no debt attached.
That path has gotten a lot narrower today.
Since 1974, public college tuition has risen from $3,270 to $9,872 a year in inflation-adjusted dollars. Private tuition has climbed by a similar margin. These figures cover tuition and required fees only — not room and board.
The chart above lets you toggle between public and private tuition and offers nominal and inflation-adjusted figures, to see how much of that growth reflects inflation versus real cost changes.
Torras attributed much of this increase to a shift in funding. States have pulled back on public support per student, pushing more of the cost onto tuition. Universities have also spent more on administration and campus amenities, both of which raise the price of running a school.
“For many students attending four-year public universities, working part-time is no longer sufficient to cover tuition and living expenses in the way it was several decades ago,” said Torras. “College has become more expensive relative to what students can realistically earn while enrolled.”
Federal student lending expanded significantly starting in the 1970s, changing how many Americans have paid for college ever since. Even as tuition rose, student loans made it possible to finance a college education and repay it over time. Many Americans today are still paying off their degrees years after graduation.
So, are we better off?
Overall, the median American’s purchasing power has grown by 73% over the past 50 years. That may come as a surprise given the record-low consumer sentiment in May.
That gain didn’t land evenly, though. The purchasing power of the median income fell 43% with respect to college tuition over the same stretch, and 17% for healthcare. Not coincidentally, those are exactly the expenses most people can’t easily avoid.
Keep in mind, too, that the chart above shows a national median. Real incomes didn’t grow at the same pace for everyone, and the same paycheck can stretch differently, depending on where someone lives.
So, back to the original question: Are we better off?
Ask a retiree with a paid-off house, and the answer’s probably yes. Ask someone a few years out of college, splitting rent three ways, and it’s probably no. Same 50 years of data, completely different lives. That’s the honest takeaway here — not that the numbers are wrong, just that they can only tell you so much. Purchasing power went up. Many people still feel behind. Both of those things are true at once.
Methodology
The ConsumerAffairs Research Team analyzed key cost metrics to compare the cost of living for Americans in 1974 versus today. These metrics include:
- Median individual income (1974 to 2024): Historical income figures were adjusted to 2024 dollars to allow for direct comparison. Data is from the U.S. Census Bureau.
- Consumer price index (CPI) by category (1974 to 2024): To compare how costs have changed over time, the research team analyzed CPI data for overall inflation, shelter and medical care from the U.S. Bureau of Labor Statistics. Because these CPI categories use different base years, all indexes were reindexed so that 1974 equals 100.
- Education CPI (custom): The BLS education CPI series does not provide consistent data back to 1974, so the research team constructed a custom education price index using nominal (noninflation-adjusted) average tuition and required fees for four-year public institutions. The index was calculated as: (tuition in year X ÷ tuition in 1974) × 100, making it directly comparable to the other CPI series. Data is from the National Center for Education Statistics.
- Purchasing power by category (1974 and 2024): Purchasing power was calculated by dividing the median individual income by the relevant category-specific CPI. An increase from 1974 to 2024 indicates the median income could buy more of that good or service in 2024, while a decrease indicates it could buy less.
- Median home sale price (1974 to 2024): Historical home prices were adjusted to 2024 dollars. Data is from the Federal Reserve Bank of St. Louis.
- Median monthly rent (1974 to 2024): Historical rent prices were adjusted to 2024 dollars. Data from 1974 to 2009 was sourced from the U.S. Census Bureau's American Housing Survey, while data from 2010 to 2024 was sourced from the American Community Survey.
- For years when rental data was unavailable — including gaps every other year from 1982 to 2008 and 2020 — values were estimated using CPI inflation adjustments based on the prior year's figure.
- Out-of-pocket healthcare spending per capita (1974 to 2024): Out-of-pocket spending includes costs paid directly by consumers, such as deductibles, copays and coinsurance. Per capita spending was calculated using aggregate spending and population data from the Centers for Medicare & Medicaid Services national health expenditure tables. Historical figures were adjusted to 2024 dollars.
- Average annual tuition and required fees for public and private four-year colleges (1974 ot 2024): Figures include tuition and required fees only and exclude room and board. Historical tuition costs were adjusted to 2024 dollars. Data is from the National Center for Education Statistics.
Reference policy
We love it when people share our findings! If you do, please link back to our original article to credit our research.
Questions?
For questions about the data or if you'd like to set up an interview, please contact egomes@consumeraffairs.com.
Article sources
ConsumerAffairs writers primarily rely on government data, industry experts and original research from other reputable publications to inform their work. Specific sources for this article include:
- U.S. Bureau of Labor Statistics, "Top Picks." Accessed July 7, 2026.
- U.S. Department of Education, “Table 330.10. Average undergraduate tuition, fees, room, and board rates charged for full-time students in degree-granting postsecondary institutions, by level and control of institution: Selected academic years, 1963-64 through 2023-24.” Accessed July 7, 2026.
- Federal Reserve Bank of St. Louis, "Median Sales Price of Houses Sold for the United States." Accessed July 7, 2026.
- U.S. Census Bureau, "American Housing Survey (AHS) Data." Accessed July 7, 2026.
- U.S. Census Bureau, "American Community Survey Data." Accessed July 7, 2026.
- Centers for Medicare & Medicaid Services, "Historical." Accessed July 7, 2026.
- U.S. Census Bureau, "Historical Income Tables: People." Accessed July 7, 2026.
- National Association of Realtors, “Settling In, Not Slowing Down: Buyers 60+ by the Numbers.” Accessed July 7, 2026.
- Education Writers Association, “History and Background: Student Loans.” Accessed July 7, 2026.