How Many Cars Are in the U.S.? 2026
+2 more

In 2022, American drivers spent an average of 60.2 minutes driving 30.1 miles per day. The rising costs of owning a vehicle — including historically high auto loan interest rates and increasing insurance premiums — contributed to a steady decline in new auto sales from 2018 to 2022.
Although there was a brief rebound in 2021, sales in 2022 were the lowest in over a decade. Still, the total number of vehicles on the road continued to grow modestly, increasing from about 276 million in 2020 to 282 million in 2021, and reaching 284.6 million in 2023. In 2022, the 255 million licensed drivers in the U.S. spent a combined 93 billion hours on the road.
In 2023, there were 284,566,442 commercial and personal vehicles registered to drivers in the U.S.
Jump to insight91.7% of U.S. households own at least one vehicle, and nearly 22% have three or more vehicles.
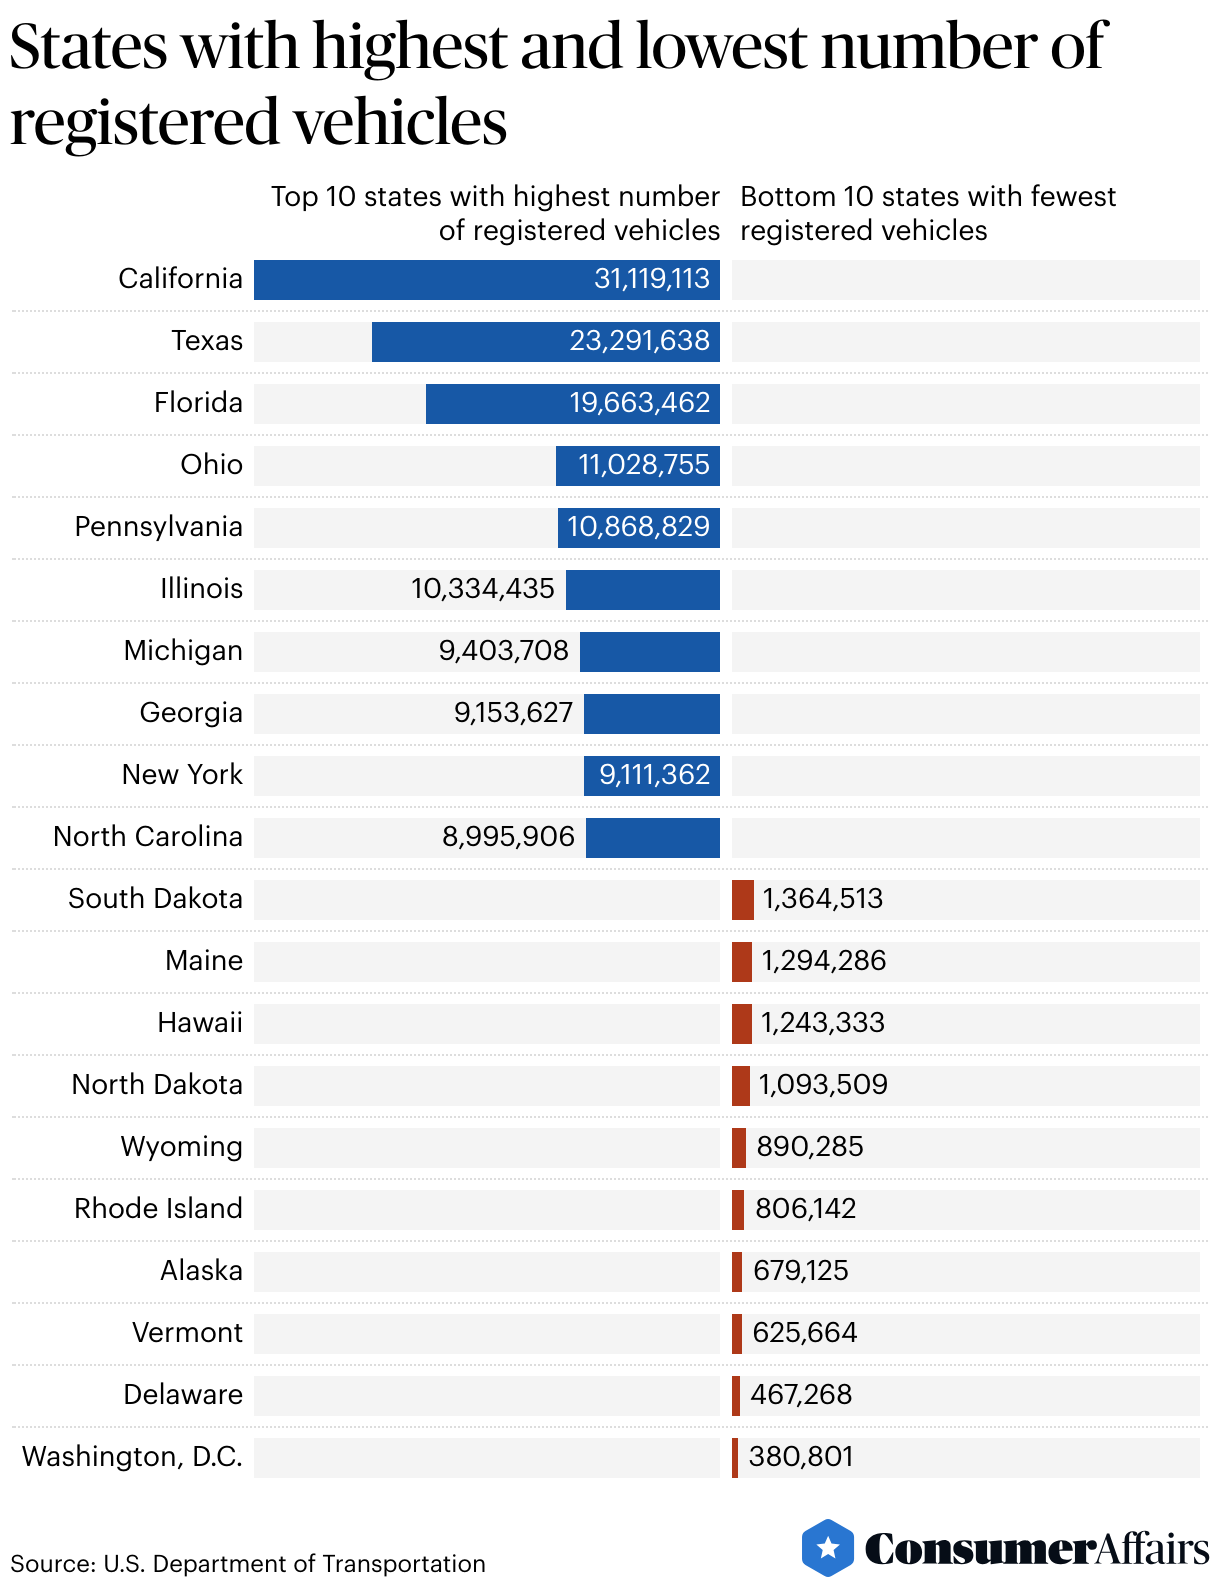
Jump to insightCalifornia, Texas and Florida have the highest number of registered vehicles, while Washington, D.C., Vermont and Delaware have the lowest.
Jump to insightThe price of car ownership is rising. Annual new car ownership costs increased more than 13% between 2022 and 2023, totaling over $12,182. The average 2023 U.S. auto loan interest rate is 7.2%, the highest since 2007.
Jump to insightU.S. car ownership overview
In 2023, there were 284,566,442 registered vehicles in the U.S., 279,945,533 private and commercial vehicles and 4,668,736 publicly owned vehicles. 92% of U.S. households had at least one automobile, and over 22% owned three or more. 2023 traffic volume outpaced 2022, with a 2.1% year-over-year increase in vehicle miles traveled from 2022 to 2023.
Crossover SUVs remain the preferred personal vehicle, comprising 45% of U.S. auto sales as of June 2022. The most popular models include the Honda CR-V, the Toyota RAV4 and the Nissan Rogue.
The U.S. Census Bureau 2021 Vehicle Inventory and Use Survey logged 808,000 registered pickup trucks.
Car ownership over time (2018-2024)
The number of U.S. households owning at least one vehicle has generally risen from 221,399,887 in 2018 to 236,480,231 in 2022, an overall increase of about 6.8%. The only exception is a dip in 2020, when driving was less necessary during COVID-19 lockdowns. Following lockdowns, more people needed to drive, so the number of households with at least one vehicle jumped 4.6% from 2020 to 2021. In 2024, 242,292,824 households owned at least one vehicle.

The rising cost of U.S. car ownership
Annual car ownership costs increased more than 13% between 2022 and 2023 to total over $12,182. (AAA 2024)
The average 2023 U.S. auto loan interest rate jumped two percentage points year-over-year to 7.2%, the highest rate since 2007. Despite easing inflation, the cost of vehicle repairs rose 17% between August 2022 and 2023. Even maintenance measures, such as an oil change, jumped 9% during the same time frame. Mounting costs, coupled with auto loan interest hikes and P&C insurance premiums, may have deterred younger generations from purchasing cars.
- Roughly half of all U.S. automobile owners are over 60 years old.
- As Gen Z ages, they will drive auto sales, as 35% of them do not have a car and comprise 63% of prospective auto shoppers.
(Sola, 2024, AAA, 2024, Statista, 2024, Kantar, 2024)
Registered vehicles by state
California, Texas, Florida, Ohio, and Pennsylvania have the highest number of registered vehicles, which generally correlates with high state populations and/or limited public transit options. (U.S. DOT, 2024)
In contrast, Washington, D.C, Delaware, Vermont, Alaska and Rhode Island have the fewest registered vehicles, in large part due to state population relative to the rest of the country. States with large, densely populated metropolitan areas often have reliable public transit systems, making car ownership less necessary. (U.S. DOT, 2024; U.S. Census Bureau, 2024)
FAQ
How many licensed drivers are there in the U.S.?
As of 2023, there are approximately 237.7 million licensed drivers in the U.S.
How many vehicles were sold in 2022?
In 2022, the U.S. auto industry sold approximately 13.7 million new vehicles, marking the lowest annual sales in over a decade, largely due to supply chain disruptions and high vehicle prices.
How many cars are in the world in 2025?
As of 2025, there are 1.6 billion cars in the world.
Which country has the most cars per capita?
New Zealand has the highest number of cars per capita at 0.9 vehicles per capita, followed by the U.S. at 0.89 vehicles per capita.
Article sources
ConsumerAffairs writers primarily rely on government data, industry experts, and original research from other reputable publications to inform their work. Specific sources for this article include:
- CNBC, “Automakers are cautiously optimistic for a 2023 rebound after worst new vehicle sales in more than a decade.” Accessed Jan. 4, 2024.
- CNBC, “As interest rates, inventory issues keep car costs high, what drivers are doing to make ownership possible.” Accessed Jan. 3, 2024.
- Hedges & Company, “How Many Cars Are There In The World in 2025?” Accessed Sept. 23, 2025.
- Pew Research Center, “1 in 10 Americans rarely or never drive a car.” Accessed Sept. 23, 2025.
- U.S. Department of Transportation, “Highway Statistics Usage 2022.” Accessed Jan. 3, 2024.
- U.S. Department of Transportation, “Highway Statistics Usage 2023.” Accessed Sept. 23, 2025.
- U.S. Department of Transportation, “October 2023 Volume Trends.” Accessed Jan. 3, 2024.
- U.S. Department of Transportation, “State Motor-Vehicle Registrations - 2023.” Accessed Sept. 23, 2025.
- U.S. Census Bureau, “2022 American Community Survey: 1-Year Estimates Data Profiles.” Accessed Jan. 3, 2024.
- Statista, “U.S. light vehicle market in June 2021 and 2022, by segment.” Accessed Jan. 21, 2024.
- Statista, “US Car Owners as of 2021, by age group.” Accessed Jan. 4, 2024.
- Statista, “Light vehicle retail sales in the United States from 1976 to 2024.” Accessed Sept. 23, 2025.
- American Automobile Association, “Annual New Car Ownership Costs Boil Over $12K.” Accessed Jan. 3, 2024.
- Kantar, “How consumers navigate the road to buying a new car.“ Accessed Jan. 4, 2024.
Figures