Where Americans Are Drowning in Debt — and Falling Behind
+1 more

Imagine that for every $1 you earned, you owed $1.40 in debt. How would you feel about your finances? Would you consider yourself solvent?
This isn’t just a thought experiment — it’s a financial snapshot of the American consumer. In 2026, the average individual debt burden in the U.S. is $63,200. That outpaces the nation’s average annual individual income ($45,256) by a staggering 40%.
In some parts of the country, residents are managing these burdens and treading water. But in others, people are struggling with debt and barely staying afloat.
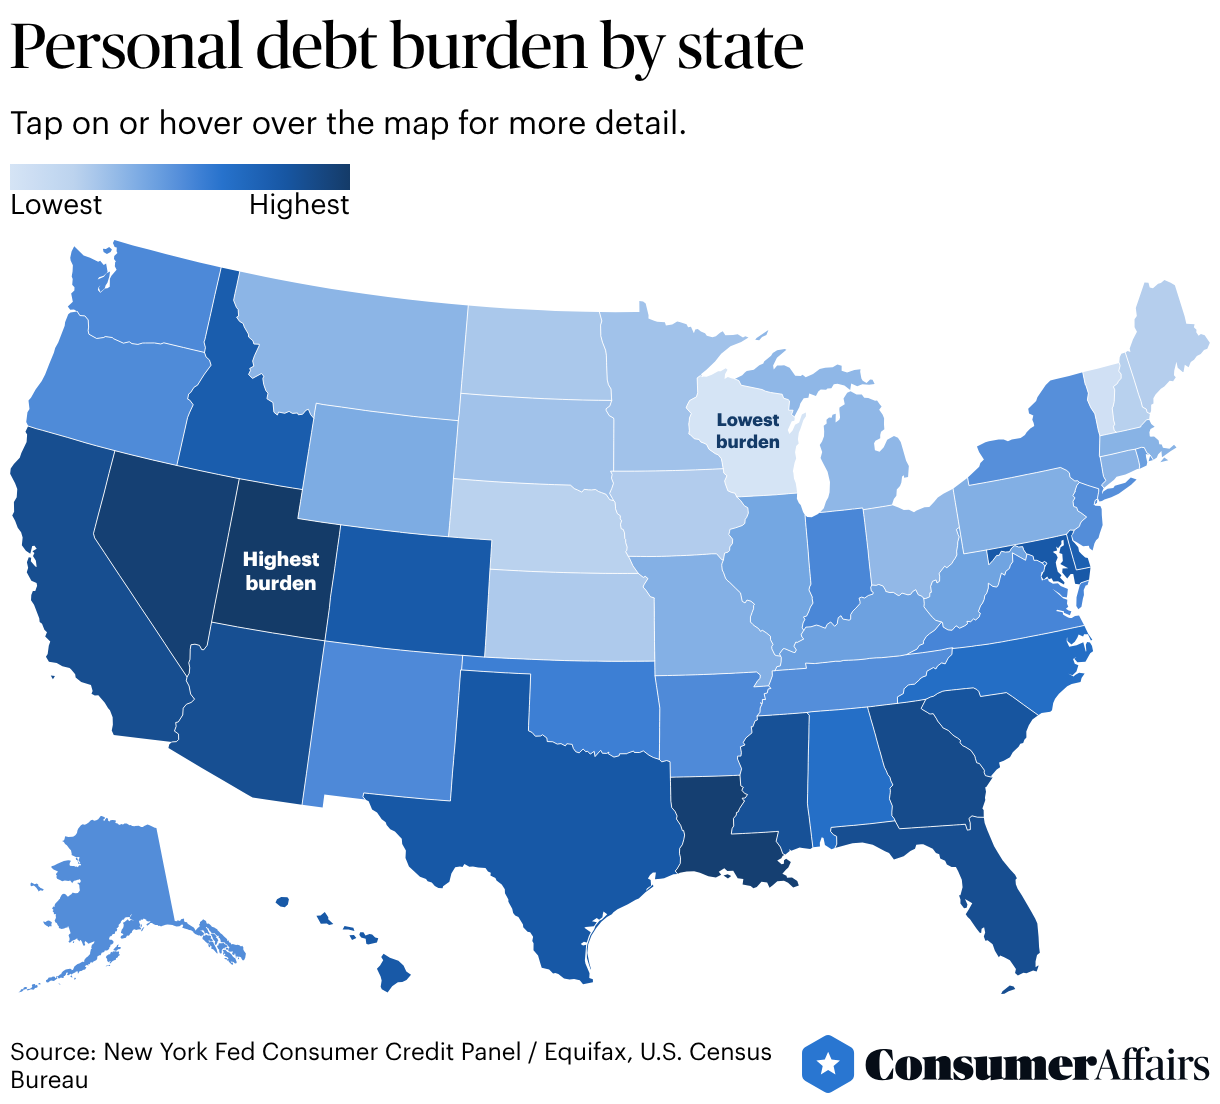
To identify where Americans are most burdened by debt, the ConsumerAffairs Research Team analyzed debt balances and serious delinquency rates in all 50 states and Washington, D.C., using the latest data from the Federal Reserve Bank of New York. Keep reading to see where your state ranks.
Utah ranks as the most debt-burdened state in the nation, with a debt-to-income ratio of 199.4%, the highest of any state.
Jump to insightLouisiana ranks No. 2 overall, with the highest percentage of mortgage debt (1.83%) 90 days past due.
Jump to insightNevada has the highest share of delinquent credit card debt, at 16.3%, which is four points above the national average.
Jump to insightMississippi residents face the steepest student loan delinquency rate in the country, with 13.4% of total balances 90 days past due.
Jump to insightWisconsin is the least debt-burdened state, with the lowest delinquencies in the country for mortgages, credit cards and student loans.
Jump to insightHow personal debt is changing across the U.S.
Before we dig into state-by-state findings, it’s worth noting the national trends of where our debt comes from and how things have shifted in recent decades.
Since 2003, total debt per capita has climbed from $32,840 to $63,200. In inflation-adjusted dollars, that’s an increase of about 10%.
Over the same period, debt burdens related to some of life’s biggest purchases have followed a similar trajectory. Accounting for inflation, auto loan debt has increased by 9%, while mortgage debt has increased by 6%. By comparison, credit card debt has actually decreased by 16%.
Check out the charts below for a snapshot of the nation’s consumer debt.
While it represents only about 9% of the average individual debt burden, student loan debt is the category with the sharpest climb. Since 2003, the average personal student loan debt has nearly tripled after adjustment for inflation.
And under current economic and policy conditions, student loan debt is an area of particular concern. The end of the Biden administration’s SAVE student loan repayment plan is “likely to result in an unpleasant surprise for many borrowers,” said Jeni Burckart, a student loan expert and the vice president of health care and workforce services at Tuition.io, a provider of student loan repayment and education benefits for employers. (In March 2026, a federal appeals court ended the SAVE program.)
“Many borrowers have tuned out or taken a wait-and-see approach to repayment,” Burckart said. “If these borrowers don't act, it is quite possible that the Department of Education will push them to the standard repayment plan, and they will be unable to afford the high monthly payments.”
The hidden cost of debt
“Americans are already in serious delinquency, and the picture does not show signs of improving,” said Austin Kilgore, an analyst with the Achieve Center for Consumer Insights. In a recent survey, Achieve, a digital personal finance company, found that more than half of consumers (51%) have taken one or more risky financial actions after falling short on what they owe — including drawing down emergency savings, missing payments on existing debt or skipping medical treatment.
“What’s important to understand is that the longer this goes on, the deeper the hole becomes,” Kilgore said. “Once a consumer starts missing payments and delaying (or forgoing) health care, more negative actions take place and the situation becomes harder to reverse,” Kilgore added.
States where residents are most burdened by debt
With the exception of California — a high-income, high-cost-of-living state — there’s a key thread uniting the worst-ranked states: They all have below-average incomes. Put another way? Residents in these states simply don’t make enough to stay on top of what they owe.
That’s not the only throughline, though. The worst-ranked states are also all in the West and South. (This trend isn’t limited to the top five — jump to the full data table for more context.)
Check out the map below, then read on for a closer look at the most debt-burdened states in the U.S.
1. Utah
Utah is the most debt-burdened state in America. Residents of the Beehive State have the highest debt-to-income ratio in the nation: 199.4%. That means the average person in Utah is carrying nearly twice as much debt as their annual income.
While some Utahns may be stretched thin by heavy debt burdens, they’re still keeping up with payments. The share of debt in serious delinquency is well below the national average in each of the four metrics we evaluated.
For some residents, a high debt ratio may not be altogether negative. The Provo and Salt Lake City metro areas have some of the highest shares of young homeowners in the country. For these Utahns, a higher debt burden may simply be a reflection of taking on the “good debt” of a mortgage earlier in adulthood, before their careers have matured into higher incomes.
Key metrics:
- Total debt per capita: $83,350 (sixth highest)
- Per-capita income: $41,806
- Debt-to-income ratio: 199.4% (highest)
2. Louisiana
In Louisiana, 1.83% of outstanding mortgage balances are 90 or more days past due — the highest rate in the U.S. and nearly double the national figure.
Unfortunately, this isn’t the only debt where residents are behind. The Pelican State has the highest overall score for delinquency, ranking in the worst five states across each of the other key debt categories we evaluated (credit cards, student loans and car loans). It isn’t surprising that residents are having greater difficulty staying current on payments; Louisiana has one of the lowest per-capita incomes in the country.
Key metrics:
- Total debt per capita: $48,250
- Per-capita income: $35,440 (fourth lowest)
- Debt-to-income ratio: 136.1%
3. Nevada
Nevada owes its high rank to an alarmingly high credit card delinquency rate. Over 16% of total credit card balances, or nearly $1 of every $6 of credit card debt, is in serious delinquency (90 days past due). That’s the highest rate in the nation, and nearly four points higher than the national average.
The Silver State also ranks among the top 10 states for total individual debt balance (12.8% above the national average) and debt-to-income burden (28 percentage points higher than the national ratio).
Nevadans’ credit card debt can’t all necessarily be attributed to high costs of living; the state is actually less expensive than the national average in some areas. Instead, consistently high unemployment rates may help explain the high debt balances and delinquent amounts in the state. (Unemployment hasn’t fallen below 5% since February 2020.)
Key metrics:
- Total debt per capita: $71,260 (10th highest)
- Per-capita income: $42,545
- Debt-to-income ratio: 167.5% (sixth highest)
4. Georgia
The Peach State shows us that even a below-average debt balance won’t necessarily spare you from a high debt burden. Georgia’s average per-capita debt is roughly $1,000 less than the national average, but incomes are below average, too. That leaves residents with a debt-to-income ratio of about 148%, putting Georgia in the top quarter of states for that metric.
Georgia is also home to some of the most delinquent debtors, ranking fourth worst overall in combined delinquency score. It is among the six worst states for delinquency in each of the categories we evaluated.
Key metrics:
- Total debt per capita: $62,070
- Per-capita income: $41,996
- Debt-to-income ratio: 147.8%
5. California
California is the only state in the top 10 where income per capita is above the national average — and by a healthy margin (10%).
Unfortunately, not even that high earning power prevents California from ranking among the most debt-burdened states. California has the third-highest debt-to-income ratio in the country, and the average individual debt balance is more than $20,000 above the national average.
One bright spot? Californians carry a relatively low share of their debt in serious delinquency — especially for housing debt. It may take a quarter of a century to save for a down payment in the Golden State, but only 0.63% of all mortgage debt there is 90 days past due.
Key metrics:
- Total debt per capita: $87,850 (third highest)
- Per-capita income: $49,934
- Debt-to-income ratio: 175.9% (third highest)
States where residents are least burdened by debt
There’s no state where the average individual income exceeds the average debt per capita. However, in some parts of the country, the debt-to-income ratio is much more manageable. Residents of the following states rank as the least debt-burdened in the country.
In a stark contrast to the most debt-burdened states, the 10 least debt-burdened states are exclusively from the Northeast and Midwest. Specifically, note the clusters in New England (Vermont, New Hampshire, Maine) and the western part of the Midwest (Nebraska, Iowa, Kansas, the Dakotas and Minnesota).
In the topmost spot is Wisconsin. Residents in America’s Dairyland seem to know how to manage their cheddar: The state ranks dead last for the percentage of mortgage, credit card and student loan debt delinquency.
But the underlying factors aren’t all geographical. Each of the above states has an average income of at least $40,000 a year — providing a reasonable “floor” to help build a solid financial foundation.
How debt burden compares by state
Take a holistic look at the rankings, and you’ll notice some meaningful regional trends — namely, a stark “continental divide.” Western and Southern states dominate the most-debt-burdened end of the list; the first Midwestern state doesn’t appear until 21 spots down (Indiana), and the first Northeastern state doesn’t appear until No. 27 (New Jersey). Then, those regions are common in the least-debt-burdened end of the rankings.
These regional tendencies are far from monolithic, though. In particular, the South is home to several interesting tensions in the data, highlighting broader trends about American debt:
- Debt and income don’t always have a linear relationship. Washington, D.C., has the highest total debt per capita in the entire dataset, at $102,400, but it ranks No. 17 overall for debt burden. The high wages in the capital help keep the average resident from drowning in debt.
- Low cost of living doesn’t always keep debt at bay. For example, Florida ranks sixth most debt-burdened, despite the lack of a state income tax. High shares of debt that are seriously delinquent, especially for mortgages and credit card debt, drive this rank.
- A hidden layer of housing debt stress that doesn't always show up in mortgage data? “Homeownership costs, including property taxes, insurance and utilities, have risen 45% on average since 2019, well above inflation,” said Selma Hepp, the chief economist at Cotality, a real estate data and analytics company. “Nearly 10% of all borrowers now have tax and insurance costs that exceed their actual principal and interest payments.”
- Debt management is about timeliness, not just volume. Mississippi has one of the lowest average individual debt balances in the country, but the state ranks eighth worst for debt burden. High shares of debt in delinquency in all four categories pulled the state into the top 10 most debt-burdened.
For the full story, check out the table below.
How to manage your debt effectively
While living in a particular state — or moving to a new one — won’t magically clear your debts, there are many practical strategies you can use to reduce your debt burden.
Check out these tips for managing what you owe, no matter where you live.
- Know what you owe.
The first step to solving any problem? Awareness — and debt is no exception. To form a solid debt management strategy, you need a complete picture of your finances. Take a deep breath and get all the numbers in one place so you know what you’re up against.
- Prioritize accordingly.
Experts often recommend two key methods for paying down debt:
- The “debt snowball,” where you start paying off the smallest balances first to build momentum
- The “debt avalanche,” where you focus on your highest-interest debts first and make only minimum payments on the others
Consider which might best suit your financial situation and help you build confidence to keep going.
- Seek opportunities to refinance, as you’re able.
“Refinancing continues to be one of the most underutilized options for relief,” said Jeff Hutcheson, founder of AUTOPAY, an online marketplace for car loans. Most borrowers lock in their rate at the site of purchase — such as a car dealership — and never revisit it, even if their credit score improves or the market rates shift, he explained. “But even a modest rate reduction of even 1% to 2% can equal hundreds of dollars in savings annually,” he said.
- Consider debt settlement options.
If you’re recovering from a major financial hardship, like loss of a loved one, major medical expenses, job loss or even a divorce, debt settlement (where a company negotiates with creditors to lower what you owe) may help you bring down your debt, explained Sean Fox, president of debt relief at Achieve. “It is not a panacea, but it can be effective in these types of situations,” he said.
- Keep it simple.
Managing your personal finances can be complicated enough, and debt can make things even foggier. But when it comes to managing that debt, “complexity is the enemy,” said David Nassief, author of “One Page Wealth Compass.”
If debt is casting a shadow in your financial life, stay grounded in the basics: To achieve solvency, money going out needs to be less than money coming in.
Nassief recommends taking steps to increase your earning power (such as through career and skill development) to bring home more green as you shrink how much you’re in the red.
Methodology
To identify where Americans are most burdened by debt, ConsumerAffairs analyzed debt data from the Federal Reserve Bank of New York (fourth quarter of 2025) and income data from the U.S. Census Bureau (2024). We ranked all 50 states and Washington, D.C., across two equally weighted categories.
Scores across both categories were combined for a total possible score of 100 points. States with the highest overall scores were ranked as the places where residents are most burdened by debt.
- Debt-to-income ratio (50 points): This category measures total debt per capita relative to per-capita income in each state. The state with the highest ratio received the maximum number of points, with other states receiving relative scores.
- Serious delinquency rates (50 points): This category measures the share of debt that is 90 or more days past due. We analyzed delinquency rates across four debt types: mortgages (25 points), auto loans (10 points), credit cards (10 points) and student loans (5 points). The state with the highest share of debt in serious delinquency received the maximum number of points, with other states receiving relative scores.
Separately, we analyzed consumer debt balance per capita by category from 2003 to 2025 to understand broader trends over time. All historical figures were adjusted for inflation to November 2025 dollars unless otherwise noted.
Reference policy
We love it when people share our findings! If you do, please link back to our original article to credit our research.
Questions?
For questions about the data or if you’d like to set up an interview, please contact dedens@consumeraffairs.com.
Article sources
ConsumerAffairs writers primarily rely on government data, industry experts and original research from other reputable publications to inform their work. Specific sources for this article include:
- Federal Reserve Bank of New York, “Center for Microeconomic Data Data Bank.” Accessed April 20, 2026.
- U.S. Bureau of Labor Statistics, “CPI Inflation Calculator.” Accessed April 20, 2026.
- U.S. Census Bureau, “B19301 | Per Capita Income in the Past 12 Months (in 2024 Inflation-Adjusted Dollars).” Accessed April 20, 2026.
- U.S. Department of Education, “U.S. Department of Education Announces Next Steps for Borrowers Enrolled in the Unlawful SAVE Plan.” Accessed April 20, 2026.
- Achieve, “Skimping on bills, pills and frills: Achieve survey finds over half of Americans face tough tradeoffs to manage household debt.” Accessed April 20, 2026.
- Federal Reserve Bank of St. Louis, “Unemployment Rate in Nevada.” Accessed April 20, 2026.
Figures