How Much Income Do You Need to Afford a Home in Your City?
+1 more

References to the ongoing affordability crisis in the U.S. dominate news cycles, yet millions of Americans will still move this year. If you’re considering buying a home, you may be doing so with financial concerns.
Our researchers analyzed Zillow cost data and used the financial guideline that you shouldn’t spend more than 28% of gross monthly income on housing costs to determine the yearly income required to afford the typical home in the 200 largest metros in the U.S. Curious how your metro ranks for affordability? Keep reading to find out.
American households need to earn $120,796 a year to afford a typical home (with a 10% down payment). That’s 48% more than the U.S. median household income of $81,604, but 3.2% lower than the amount needed in 2025.
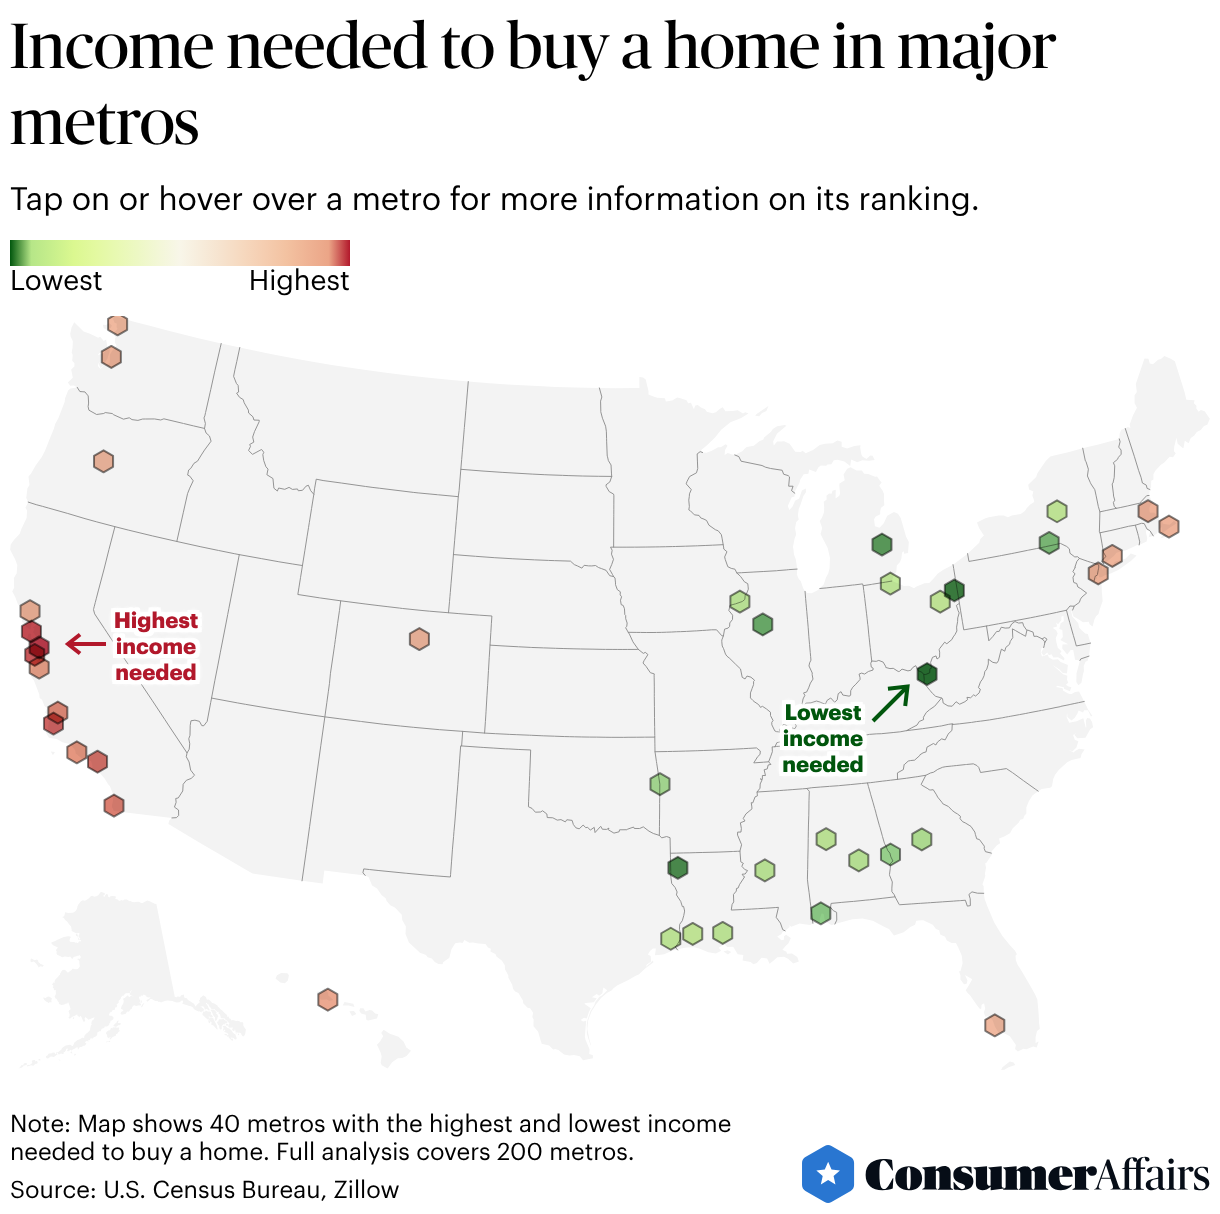
Jump to insightSan Jose, California, tops the rankings again, requiring an annual income of $501,012 to afford a typical home. Second-place San Francisco, California, sits well behind it, at $358,090 per year.
Jump to insightHuntington, West Virginia, ranks as the most affordable metro in our analysis, requiring just $53,650 a year to afford a typical home with a 10% down payment.
Jump to insightIncome requirements rose 82.8% from 2020 to 2025, from under $70,000 to nearly $125,000.
Jump to insightFor the second year in a row, nine of the 10 most income-restrictive cities are in California, with the only exception being Honolulu, Hawaii. For affordable options, buyers should look to the Midwest and South.
Jump to insightNational trends in income needed to afford a home
On a national scale, affordability has remained largely stagnant over the past year. The income needed to buy a home has dipped by about $4,000, as home prices have fallen slightly. But the average household income is still well short of the income needed to keep a monthly mortgage payment in line with the 28% rule. Things are better than before, but far from affordable.
“Affordability has improved modestly based on our Housing Affordability Index, but it’s still below normal levels,” said Nadia Evangelou, principal economist and director of real estate research at the National Association of Realtors. She added that improvement is highly dependent on where you are.
For the second year in a row, nine of the 10 metros requiring the highest incomes to buy a home are in California. Metros with the lowest income thresholds are concentrated in the South and Midwest. The gap between the top and bottom of the list is stark: The difference in annual income required to purchase the typical home in San Jose, California, and Huntington, West Virginia is $447,362.
Explore how metros rank based on the income needed to buy a home in our map below.
The last time the median U.S. household income was enough to follow the 28% rule (factoring in a 10% down payment) was 2015, when income exceeded the amount necessary by 0.4%. Today, the income required to afford a home outpaces the median household income by 48%, pushing homeownership increasingly out of reach.
This sharp swing in affordability is due to factors on both the demand and supply sides, according to the Federal Reserve Bank of St. Louis. Lower interest rates, for example, have increased demand, while zoning rules, land-use regulations and capacity constraints have limited supply. A widening income gap has also made it harder for median-income earners to compete for homes.
However, the surge in income required to buy that coincided with the pandemic, including an astronomical rise of 37.5% from 2021 to 2022, seems to finally be slowing.
“As more inventory gradually comes online and market conditions continue to normalize, we could see additional, steady progress on affordability,” said Kara Ng, a senior economist at Zillow.
Cities that require the highest income to afford a home
Of the 10 metros with the highest income requirements, nine are in California, and No. 1 on the list is the leader by far: To put 10% down on a typical home and keep your monthly mortgage payment at or below 28% of your income, you need to make $501,012 per year — nearly $143,000 more than in San Francisco, which is No. 2. (For comparison, the gap between Nos. 2 and 10 is about $103,000.)
Honolulu joining California metros in the top 10 isn’t shocking, since both Hawaii and California have been battling housing crises for years. Not all hope is lost, though. In each metro in the top 10, the income needed to afford a home has decreased by an amount greater than the national rate (3.2%) since 2025.
The 10 metros in the U.S. that require the highest income to afford a home are as follows:
- San Jose, California: $501,012
- San Francisco, California: $358,090
- Santa Cruz, California: $354,973
- Santa Maria, California: $305,535
- Los Angeles, California: $301,221
- San Diego, California: $293,618
- San Luis Obispo, California: $280,591
- Oxnard, California: $276,805
- Salinas, California: $262,403
- Honolulu, Hawaii: $255,280
Cities that require the lowest income to afford a home
Affordable metros do exist, like Huntington, West Virginia, but they often come with challenges of their own. In Huntington, for instance, the income needed to buy a home is actually 13.1% less than the median household income, but over one-fourth of Huntington’s population lives below the poverty line, according to the U.S. Census Bureau.
Nine of the 10 metros with the lowest required income to buy a home are in the South and Midwest — which might be drawing notice from people willing to relocate. As homebuying remains out of reach on the coasts, many Americans express interest in moving to more affordable areas of the U.S.
The 10 metros in the U.S. that require the lowest income to afford a home are as follows:
- Huntington, West Virginia: $53,650
- Youngstown, Ohio: $59,433
- Shreveport, Louisiana: $63,030
- Flint, Michigan: $63,535
- Peoria, Illinois: $65,486
- Binghamton, New York: $65,989
- Mobile, Alabama: $66,241
- Columbus, Georgia: $66,245
- Fort Smith, Arkansas: $67,064
- Macon, Georgia: $67,832
How home affordability compares across the U.S.
Where you live has a large effect on your homebuying power and how long it takes to save for a home, as housing markets often vary drastically across state and county lines. To use an example featuring the metros on either end of our affordability list: If someone making the median income moved from Huntington to San Jose and wanted to buy a typical home, their income would need to jump more than ninefold to follow the 28% rule.
Some notable changes from last year were seen in metro areas outside our top and bottom 10: Chicago, for example, jumped 35 places, as the yearly income needed to buy a home rose by almost $20,000. Many Southern and Midwestern metros, such as Milwaukee, Wisconsin, and Jacksonville, Florida, saw changes toward more affordability in their rankings. Still, there are only four metros where the income needed to satisfy the 28% rule is less than the median household income: Flint, Michigan; Davenport, Iowa; Peoria, Illinois; and Huntington, West Virginia.
In our full table below, check out where each metro ranks — and what’s changed from last year.
How to prepare financially for homeownership
Aspiring homebuyers can’t control the housing market, but they can control how prepared they are to enter it. By saving and making strategic financial decisions, you can prepare your finances so that when the moment is right, you have the purchasing power you need to afford the right home.
To best prepare your finances, consider the following steps:
- Start with the 28/36 rule. This common rule of thumb suggests that your housing costs should take up no more than 28% of your gross monthly income, and that your total debt payments shouldn’t exceed 36%. With this baseline, you can better research markets and homes that match your finances.
- Save early for a down payment. First, set a target based on the price range you’re aiming for — typical down payments range anywhere from 5% to 20% of the home price. Create a monthly savings plan and consider setting up automatic transfers into a dedicated savings account. Even small, consistent contributions can add up over time, so the earlier you begin saving, the better off you’ll be when it’s time to buy.
- Calculate how much house you can afford realistically. Take into account your preexisting debts, credit score, income and how much you have for a down payment.
- Research local tax and homeowners insurance rates. Look into local income and property taxes. The cost of homeowners’ insurance also varies by where a property is located.
- Check out local housing programs. Saving up for a down payment is one of the trickiest parts of homebuying, says Evangelou from NAR. “But there are more resources than many people think. There are many local and state programs that can help them, so it’s worth exploring those options and talking to a lender early,” she said.
Methodology
To estimate the minimum income needed to afford a typical home in each metro, we applied the 28/36 rule, which recommends spending no more than 28% of gross monthly income on housing.
Throughout this analysis, “city” and “metro” may be used interchangeably in the copy, though the underlying Zillow data and affordability calculations are based on metro-level housing market definitions.
We used Zillow's total monthly payment data, including a 10% down payment from February 2026, as a metric for typical monthly home payments across the 200 largest U.S. metros by population. We divided this figure by 28% to determine the minimum monthly income needed to abide by the 28/36 guideline, and multiplied it by 12 to calculate the yearly income. We then ranked the metro areas from highest to lowest required income.
We also pulled in additional data for context, including median household income from the U.S. Census Bureau (2024) and February 2026 home price data from Zillow. These figures were not used in affordability calculations.
Reference policy
We love it when people share our findings! If you do, please link back to our original article to credit our research.
Questions?
For questions about the data or if you’d like to set up an interview, please contact dedens@consumeraffairs.com.
Article sources
ConsumerAffairs writers primarily rely on government data, industry experts and original research from other reputable publications to inform their work. Specific sources for this article include:
- U.S. Census Bureau, “Explore Census Data.” Accessed April 6, 2026.
- Zillow, “Housing Data.” Accessed April 6, 2026.
- U.S. Census Bureau, “United States Migration/Geographic Mobility At A Glance: American Community Survey 1-Year Estimates.” Accessed April 28, 2026.
- Federal Reserve Bank of St. Louis, “When Houses Outrun Paychecks: The Lost Decades of Housing Affordability.” Accessed April 28, 2026.
- U.S. Census Bureau, “QuickFacts: Huntington city, West Virginia.” Accessed April 22, 2026.
Figures